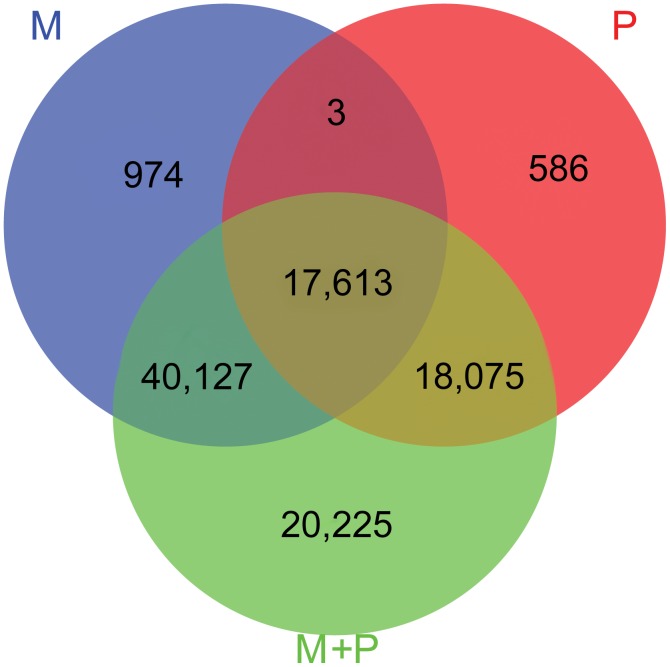
Figure 1. Venn diagram of SNPs discovered using reads of the three datasets.
M represented SNPs discovered using reads from transcriptome of L.vannmei at developmental stage of mysis, P represented SNPs discovered using reads from transcriptome of L.vannmei at developmental stage of post larva. M+P represented SNPs discovered using the reads of the two transcriptomes together.

