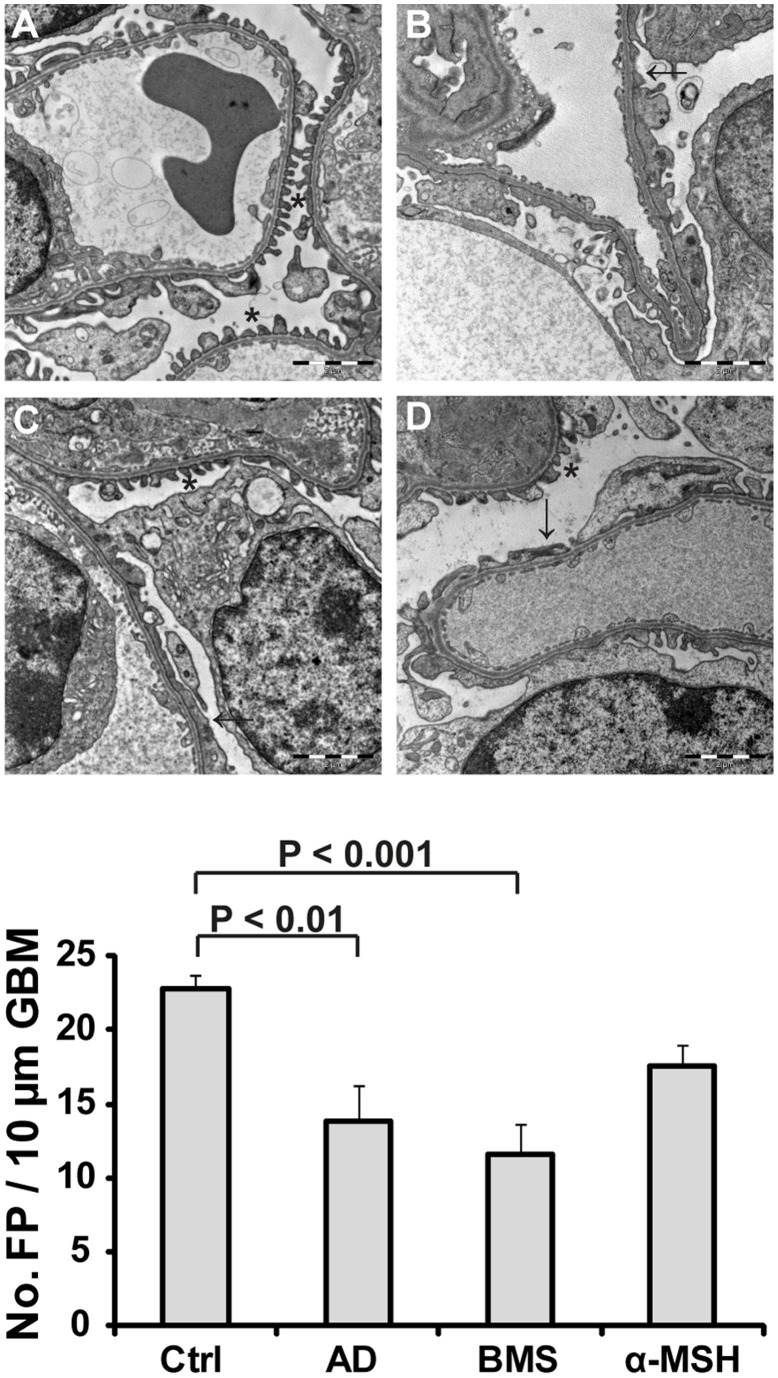
Figure 4. Glomerular morphology was disrupted in adriamycin treated mice.
Kidneys were collected for morphological analysis at day 12 after adriamycin induced nephropathy. Slides were blindly examined by a pathologist (n = 15 for all groups). Shown are representative images of (A) controls, which present a normal glomerular structure and foot processes, (B) untreated adriamycin mice, displaying a high degree of foot process effacement, (C) treatment with BMS-470539 or (D) α-MSH, showing disrupted glomerular structures similar to untreated adriamycin mice. (E) The number of podocyte foot processes per 10 µm of glomerular basement membrane was quantified. Untreated adriamycin (AD) and mice treated with BMS-470539 (BMS) or α-MSH had a lower number of foot processes compared to controls (Ctrl). *Normal foot process, → disrupted glomerular barrier structure and loss of foot processes. Scale bar = 2 µm. FP = foot processes, GBM = glomerular basement membrane.

