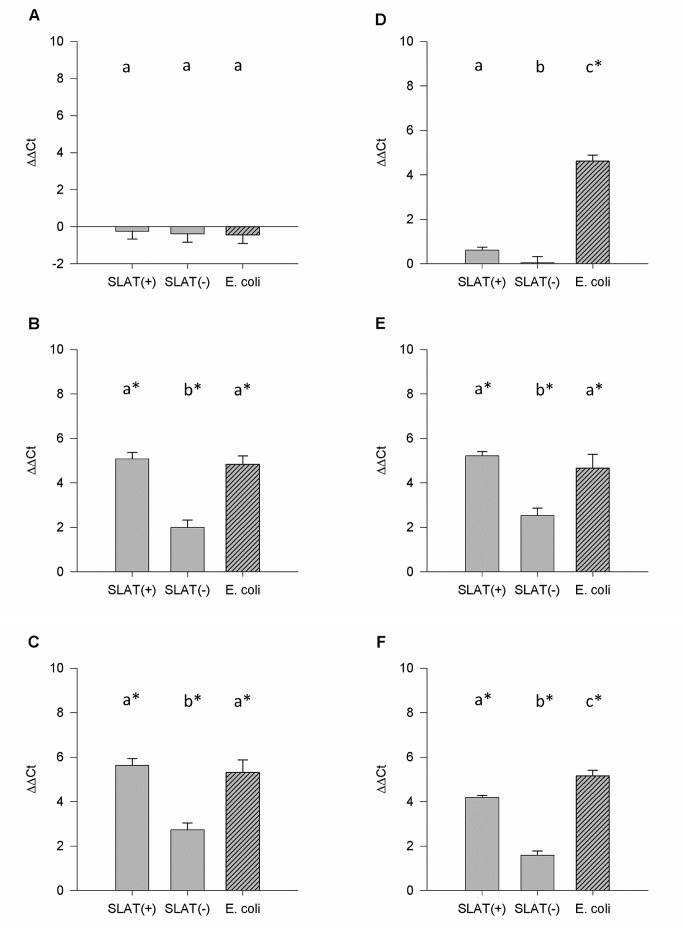
Figure 1. Relative SAA and TNF-α mRNA expression.
Relative mRNA expression (ΔΔCt) of SAA in bMEC stimulated for (A) 1 h, (B) 6 h, or (C) 24 h with SLAT(+), SLAT(−), or E. coli. Relative mRNA expression (ΔΔCt) of TNF-α in bMEC stimulated for (D) 1 h, (E) 6 h, or (F) 24 h with SLAT(+), SLAT(−) or E. coli. Data are presented as Means ± SEM. a,bMeans without common superscript letters differ (P<0.05).

