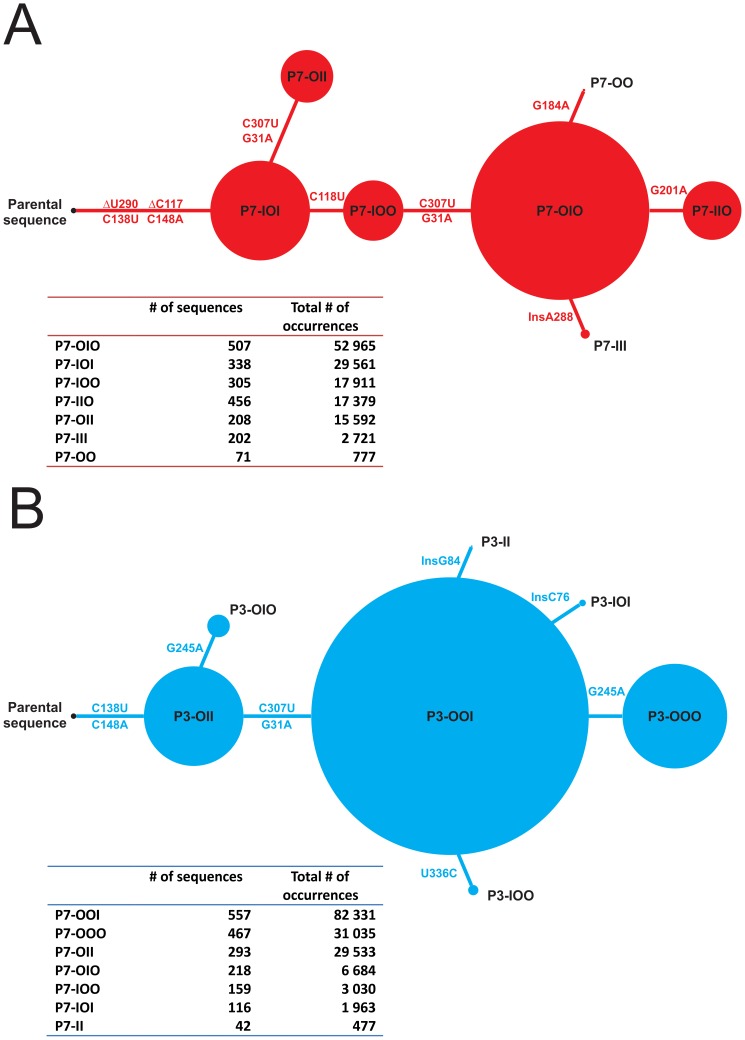
Figure 6. Clusters and discriminating mutations.
(A) Scale schematic representation of the clusters (shown here as a tree) found in the P7 library, starting with the parental sequence. Firstly, the representative sequences of each cluster were multiple aligned with the parental sequence to identified mutations that discriminate the clusters. Secondly, the representative sequences are sorted according to the number of mutations they bear regarding the parental sequence. Each cluster is represented by a red circle for which the size is determined by the total number of occurrences contained in the cluster. Also, clusters are linked with lines showing the key mutations found within the representative sequences of each cluster. Below the scheme, a table compiling the details of each cluster regarding the number of sequences, the total number of occurrences and the fraction (%) that account for the representative sequence of each cluster. (B) Same as in A, but for the P3 library using blue circles.

