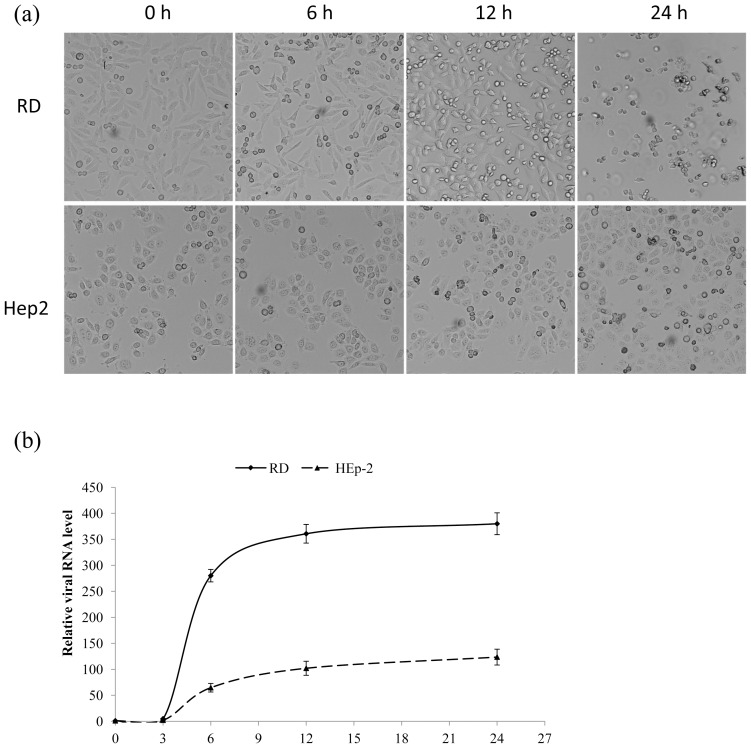
Figure 5. Cytopathic effects (CPEs) and virus replication kinetics of GD809/2011 infection.
RD and Hep-2 cells were infected with GD809/2011 at an MOI of 1. (a). The CPEs were shown by the cell morphological changes at 0, 6, 12, and 24 h p.i. (original magnification, ×100); (b). Intracellular viral RNA levels were measured at 0, 3, 6, 12, and 24 h p.i. by qRT- PCR. The relative viral RNA level at 0 h p.i. was set as 1, and the viral RNA levels at other time points were expressed as fold changes. Data shown are the mean ± SD of three independent experiments.

