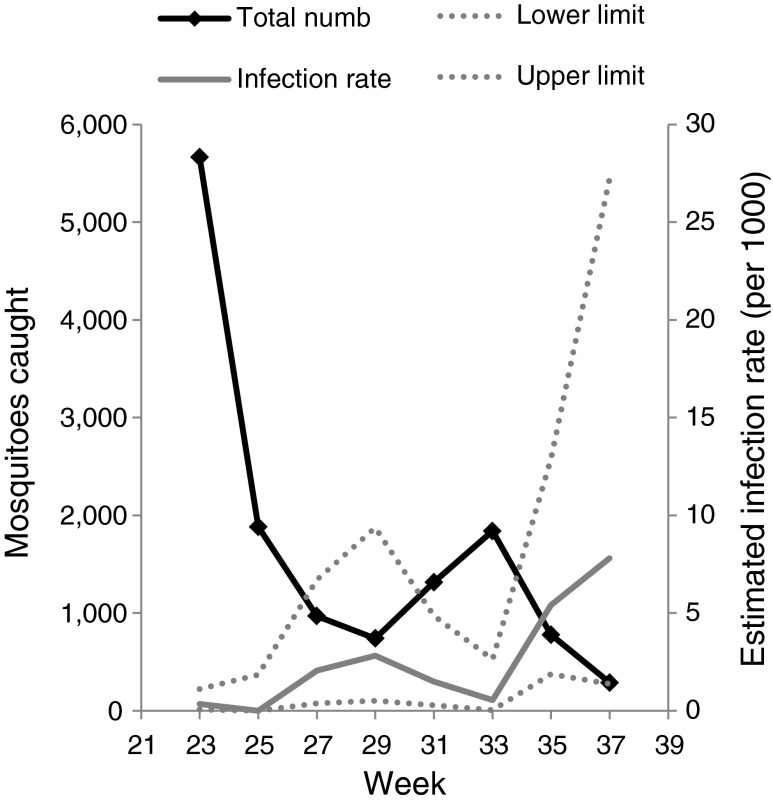
Fig. 3.
The first group of the mosquitoes collected in the field that was subjected to an initial PCR screening for the presence of F. tularensis. The number of mosquitoes caught on each sampling occasion in relation to the estimated IR per 1,000 mosquitoes collected. Dotted lines represent the calculated upper and lower IR limits. The F. tularensis infection rate were highest at 2 to 6 weeks after the peak in total number of mosquitoes

