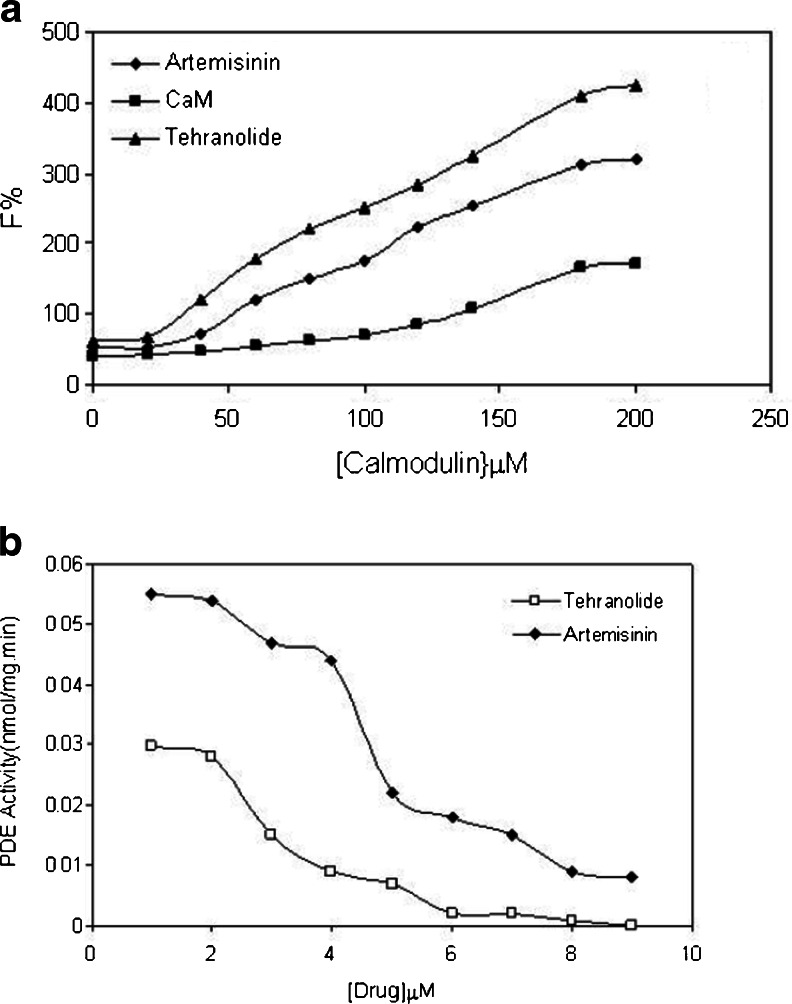
Fig. 2.
a The fluorescence spectra of calmodulin at 0.043 mg/ml concentration in 40 mM Tris–HCl buffer, pH 7.4 at 25 °C. The increment in the fluorescence emission of calmodulin by increasing its concentration in the free form and in the presence of 10−5 M of artemisinin or 10−5 M of tehranolide. b Calmodulin-dependent PDE1 activity versus the concentrations of artemisinin and tehranolide

