
Fig. 8.
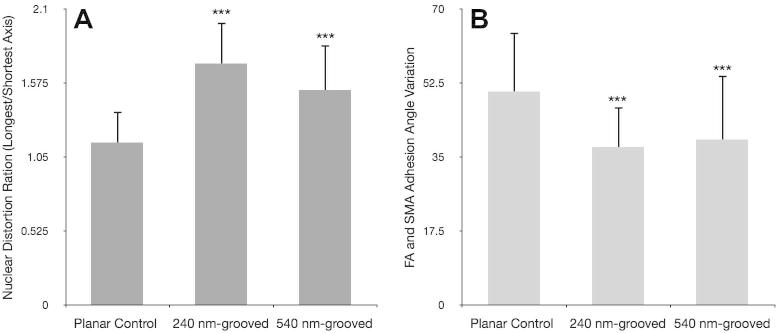
Relative focal adhesion alignment and nuclear distortion (OPGs). Focal adhesion alignment quantified via FA and SMA angle standard deviation (panel B). Nuclear distortion is presented as a ratio of longest over shortest axis, higher values indicate elongated nuclei (panel A). Statistical significance (t-test) relative to planar is noted (*p < 0.05, **p < 0.01 and ***p < 0.001). Cells cultured on grooved surfaces showed significantly more elongated nuclei and less variant adhesion angles relative to those on planar controls. 540 nm-grooved surfaces tended to correspond to more angle variation and less distorted nuclei than 240 nm-grooved surfaces, though this trend was not significant.