
Fig. 6.
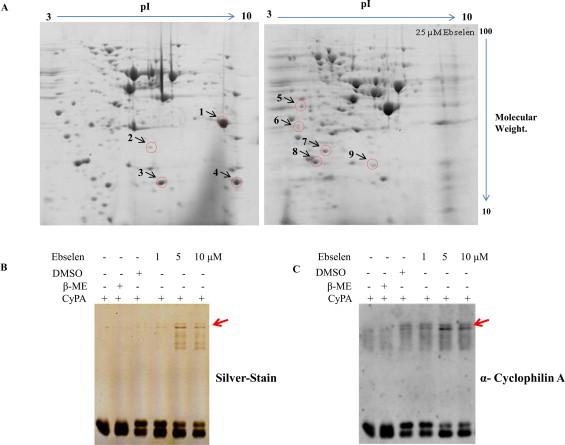
Ebselen alters the proteome profile of yeast cells: two dimensional gel electrophoresis gels are showing differentially expressed proteins in control (DMSO) and 25 μM ebselen treatment. (A) Proteins were separated in the first dimension on IEF gel (7 cm, pH 3–10) and then run on 12% SDS–PAGE. The red circles represent the protein spots which were excised from the gel for mass spectrometric analysis. The effect of ebselen on recombinant human Cyclophilin A. 5.0 μg CyPA incubated with increasing concentration of ebselen for 30 min, followed by running non-reducing SDS–PAGE (B) silver stained photograph, (C) corresponding cyclophilin A western signal image. Arrows indicate cyclophilin A complex. (For interpretation of the references to color in this figure legend, the reader is referred to the web version of this article.).