
Figure 4.
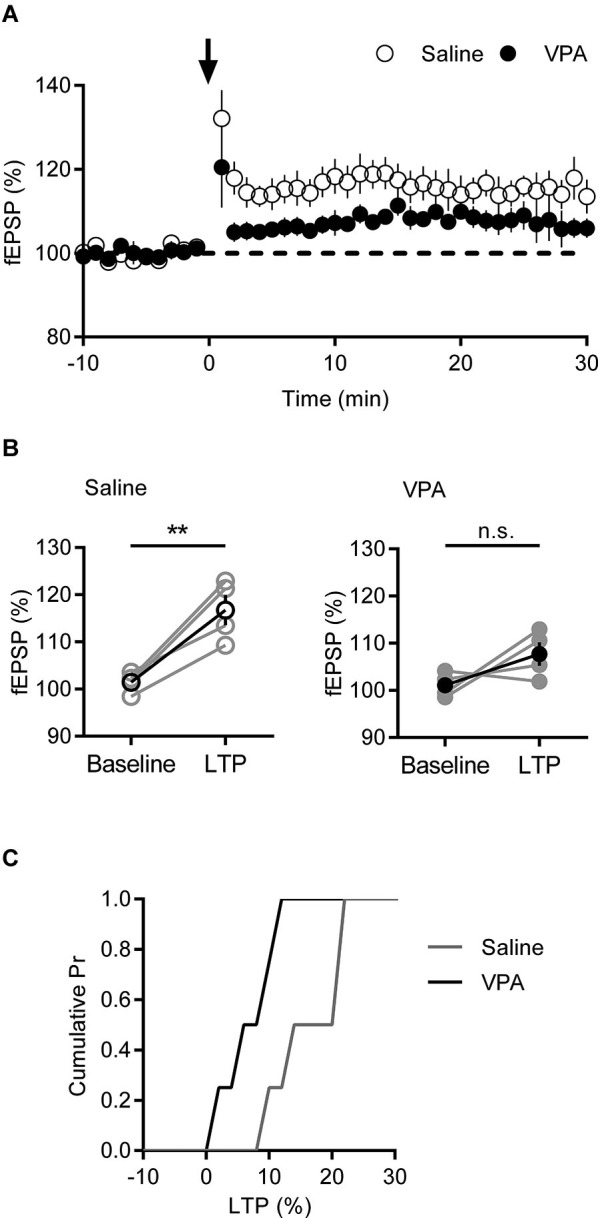
Deficits in LTP are present in VPA exposed mPFC neurons. (A) Time course of normalized fEPSP responses from layer V/VI adult rats treated with saline or VPA in utero. Theta burst LTP stimulation is indicated by arrow. (B) Change in normalized fEPSP pre- (Baseline) and post- (LTP; 25 min after TBS) theta burst stimulation LTP. Darker points represent the mean fEPSP. (C) Cumulative probability plot of percent LTP from individual experiments. Data shown as mean ± s.e.m.; ** p < 0.01.