Figure 1.
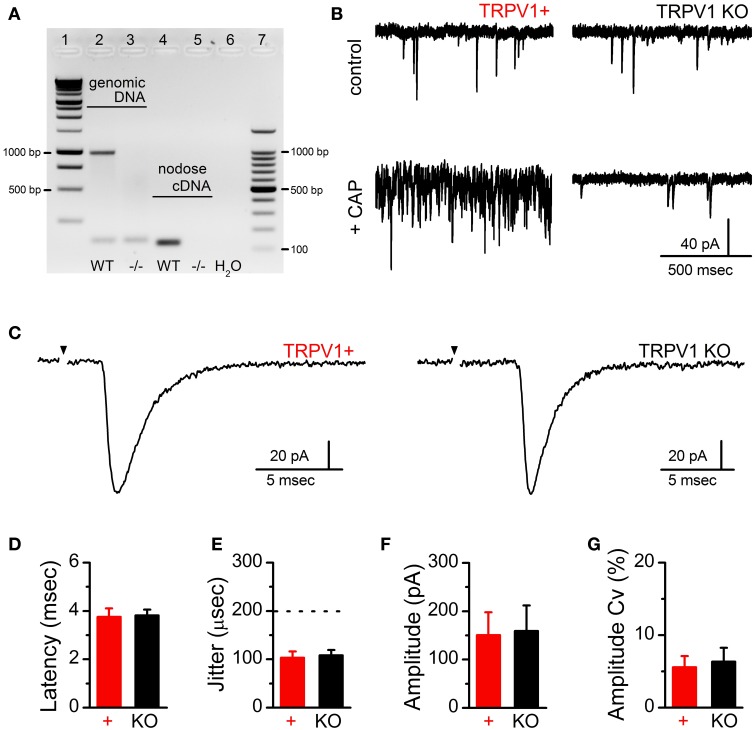
Confirmation of TRPV1 deletion and comparison of ST-evoked synchronous glutamate release between primary afferent contacts onto second-order NTS neurons from control and TRPV1 KO animals. (A) Gel electrophoresis showing the TRPV1 specific genomic DNA (predicted band at 984 bp) and nodose cDNA (predicted band at 134 bp) amplicon from control and TRPV1 KO mice. (B) Currents traces showing sEPSC frequency in control bath (upper panels) and following CAP (100 nM) exposure (lower panels) from TRPV1+ (left) and TRPV1 KO afferents. (C) Current traces comparing ST-evoked synchronous glutamate release from single ST afferent inputs confirmed to express TRPV1 (CAP sensitive) or from TRPV1 KO mice. Traces are of individual sweeps with the black arrow indicating the time of ST activation. The stimulus artifacts have been removed. There were no significant differences between control (n = 6) and TRPV1 KO (n = 13) ST afferent inputs with regards to the average latency to EPSC onset (D) or synaptic “jitter” (the dotted line indicates the threshold below which inputs are considered monosynaptic) (E) (P = 0.56 and P = 0.74 respectively, unpaired t-tests); demonstrating monosynaptic innervation from ST afferents likely expressing similar degrees of myelination. Further, neither the amplitude (F) nor coefficient of amplitude variation (Cv) (G) of single ST-EPSCs were significantly different (P = 0.93 and P = 0.95 respectively, unpaired t-tests); consistent with similar numbers of vesicle release sites (N) and release probability (Pr).

