Figure 2.
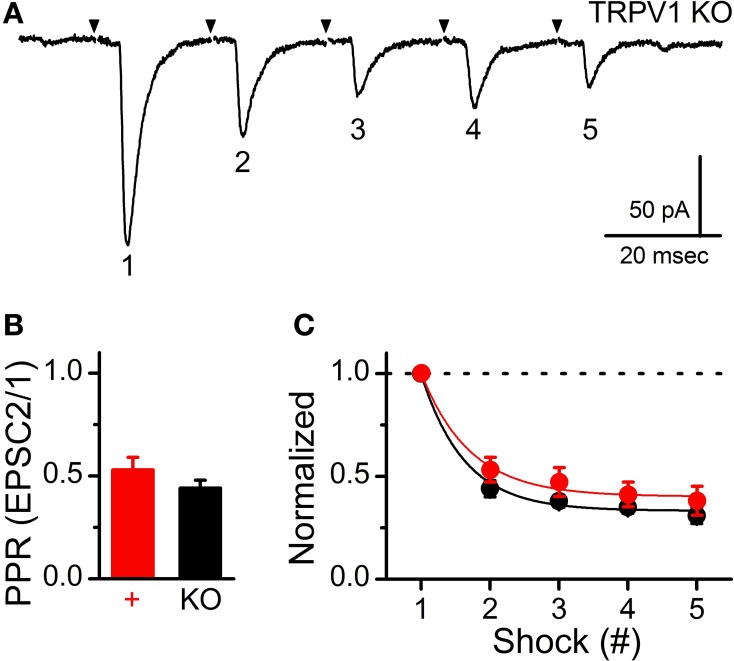
Conserved synaptic performance during trains of ST shocks between control and TRPV1 KO afferents. (A) Representative current trace showing decreasing ST-evoked EPSCs during a train of ST shocks (5 shocks at 50 Hz). Traces are of individual sweeps with the black arrow indicating the time of ST activation. The stimulus artifacts have been removed. This frequency dependent depression (FDD) is a result of a high initial probability of vesicle release (Pr) and relatively fast stimulations releasing vesicles faster than they can be mobilized to the membrane. (B) The paired-pulse ratio (PPR) comparison between evoked EPSC2 to EPSC1 (20 ms interval) showed no significant difference between groups (P = 0.08, unpaired t-test); consistent with similar initial Pr. (C) The train a stimulations produced nearly identical frequency dependent depression (FDD) profiles that were not different between groups (P = 0.93, ANOVA). Dashed line provides reference to initial EPSC1 amplitude.

