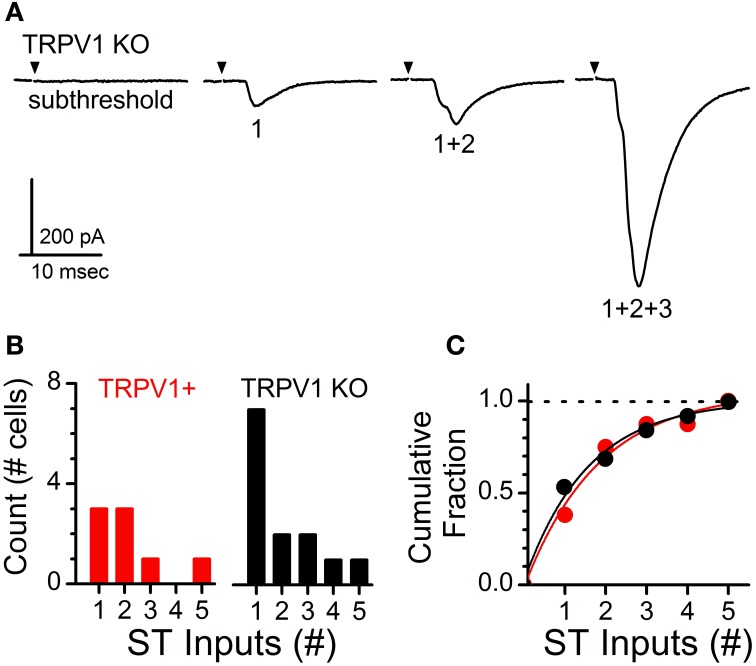
Figure 3.
Analysis of primary afferent innervation patterns onto second-order NTS neurons from control and TRPV1 KO animals. (A) Current traces showing increasing stimulus intensity recruiting a single contact followed by multiple convergent ST afferent inputs. Traces are of individual sweeps with the black arrow indicating the time of ST activation. The stimulus artifacts have been removed. Activation of multiple inputs produces a compound waveform; with individual inputs discriminated by shock intensity at activation, latency, and amplitude. (B) Histogram detailing the total number direct ST inputs across recorded neurons from each group. (C) Cumulative proportion showing no significant difference in the percentage of neurons receiving 1 or >1 inputs between control and TRPV1 KO animals (P = 0.63, Wilcoxon ranked sum test). Dashed line provides reference to 1.0 on the vertical axis.

