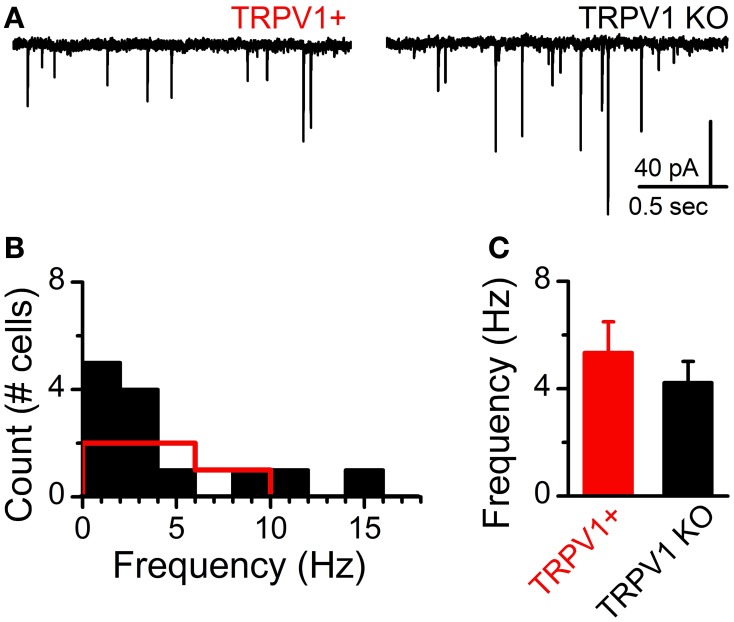
Figure 5.
Comparison of sEPSCs frequency onto NTS neurons from control (TRPV1+) and TRPV1 KO mice. (A) Current traces (Vm = −60 mV) of sEPSCs onto NTS neurons with each type of identified direct ST afferent contact. Temperature was held constant at 33°F. (B) Histogram of average sEPSC frequency across neurons (TRPV1+: n = 8 neurons, red and TRPV1 KO: n = 13 neurons, black). (C) The distribution of sEPSC frequencies was not statistically different between neurons receiving TRPV1+ and TRPV1 KO contacts (P = 0.57, unpaired t-test).

