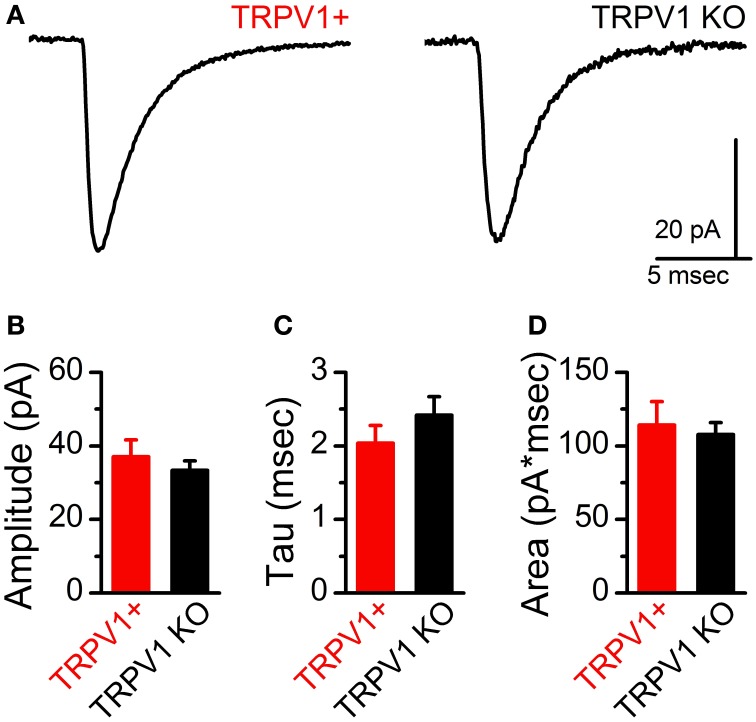
Figure 6.
No difference in spontaneous EPSC waveforms between control and TRPV KO ST afferents. (A) Representative average sEPSCs from control and TRPV1 KO afferents. Waveforms are the average of 100 events. Statistical comparison of sEPSC amplitude (B) and decay kinetics (Tau, C) and integrated current (Area, D) were not significantly different between TRPV1+ and TRPV1 KO afferents (P = 0.46, 0.71, and 0.31 respectively, unpaired t-tests).

