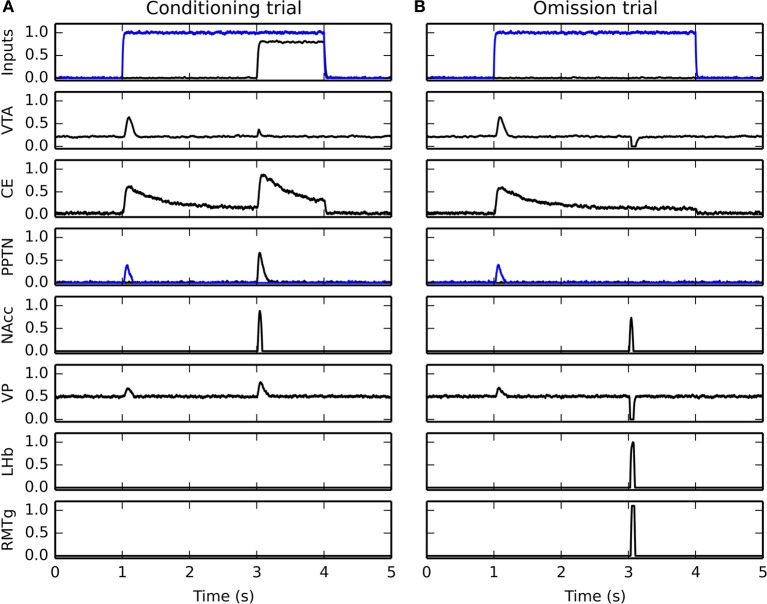
Figure 10.
Timecourse of activity in different areas of the model. Panel (A) shows the activity during the last conditioning trial of the CS1-US1 association, while panel (B) shows what happen during reward omission after learning (CS1 alone). The first row shows the inputs to the network, with the blue line showing the mean activity in the IT cluster corresponding to CS1, while the black line shows the mean activity for the neurons of LH representing US1. The second row shows the timecourse of the VTA cell during these trials, similar to what is shown on Figure 5. The third row shows activity in CE, which matches the already observed timecourse in BLA during conditioning on Figure 4. The fourth row depicts the timecourse of activity in PPTN, with the blue line showing the unit responding to CS onset (with inputs from CE) and the black the one responsive the US (with inputs from LH). The fourth, fifth, sixth, seventh, and eighth rows depicts the maximal activity in NAcc, VP, LHb, and RMTg, respectively. Please refer to the text for how these activations relate to each other.

