Figure 4.

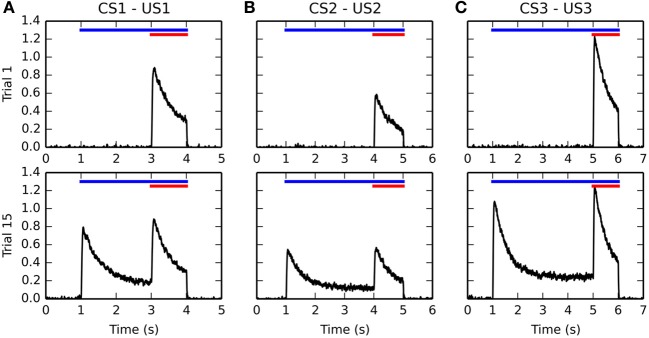
Timecourse of the activity of different BLA cells before and after conditioning. Activities for the CS1-US1, CS2-US2, and CS3-US3 associations are represented from left to right in panels (A–C), respectively. For each figure, the horizontal blue line represents the presentation of the CS, while the red line represents the presentation of the US. The top row shows the evolution of the firing rate of a single BLA neuron over time during the first trial of conditioning. Because of the sensitization phase and the lateral inhibition in BLA, there is only one cell in the population which represents each US. During the first trial, this cell gets maximally activated at the time of reward delivery (3, 4, and 5 s after the start of the trial, respectively), and its firing rate decreases because of the adaptation of excitatory inputs in BLA, before returning to baseline when the US is removed after 1 s. All other cells in BLA are not activated. The bottom row shows the activity of the same cells during the 15th trial of conditioning. They now show an increase of activity when the CS appears (1 s after the start of the trial), reaching a maximum of similar amplitude as the response evoked by the US, and slowly decreasing to a baseline of about 20% of this maximal activity. When the reward is delivered, they increase their firing rate similarly a in the first trial.
