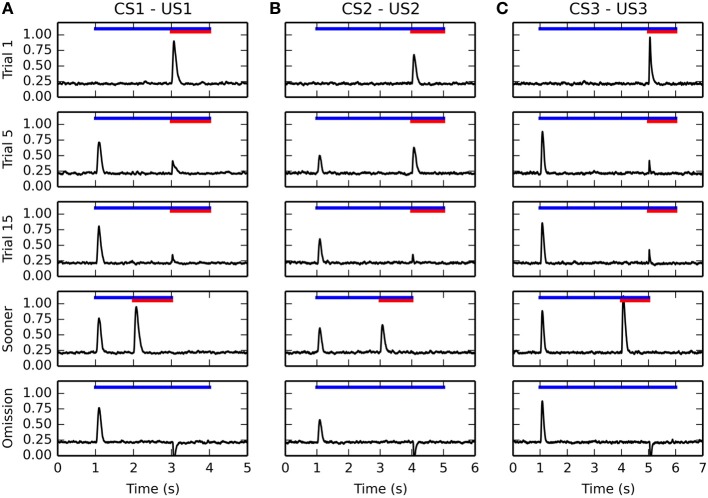
Figure 5.
Timecourse of the activity of the VTA cell during conditioning. The activity for the three CS-US associations is displayed from left to right in panels (A–C), respectively. For each figure, the horizontal blue line represents the presentation of the CS, while the red line represents the presentation of the US. The first row represents the activity of VTA during the first trial of conditioning, the second row during the 5th trial, the third during the 15th trial. They show a progressive reduction of the amplitude of the US-related burst, while the CS-related burst appears early in learning. The fourth row shows the activity of the VTA cell when the reward is delivered 1 s earlier than previously associated. It shows that the VTA cell responds to rewards delivered earlier with the same activation as for unpredicted rewards. The fifth row shows omission trials: the CS is presented normally, but the US is omitted. The VTA cell shows a phasic pause in firing at the time when reward was expected.

