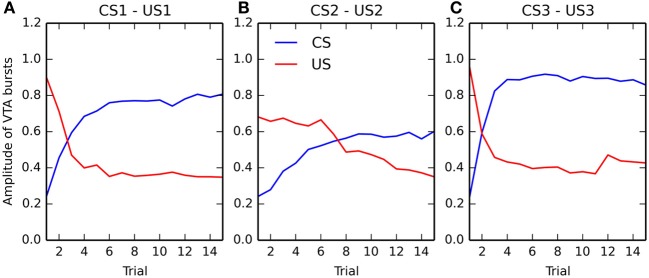
Figure 6.

Evolution of the maximal activity in VTA during conditioning. For each of the three associations (panels (A–C), respectively), the maximal activity of the VTA cell at CS onset (in blue) and at reward delivery (in red) is plotted for each trial of the conditioning phase. These values are computed by taking the maximum value of the firing rate of the VTA cell in a small time window (±100 ms) around CS onset and reward delivery. The panels show the relative speed at which the CS-related bursts appear and the one at which the US-related bursts are canceled.
