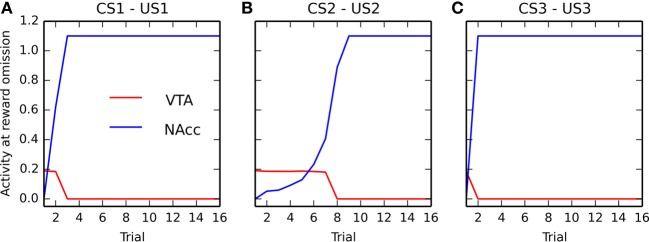
Figure 9.

Apparition of VTA dips during conditioning. For the three CS-US associations (panels (A–C), respectively), the panel represents what would happen in VTA (red) and NAcc (blue) if the reward were omitted directly after each conditioning trial. Learning is shut off during these omission trials. The red line shows the minimal activity in VTA during these omission trials. After the first few conditioning trials, this minimal activity is around the baseline (0.2), but quickly becomes equal to 0, denoting the appearance of the strong phasic inhibition of VTA at reward omission. The blue line shows the emergence of activity in NAcc at reward omission. The speed at which the timing prediction appears in the ventral BG depends on reward magnitude.
