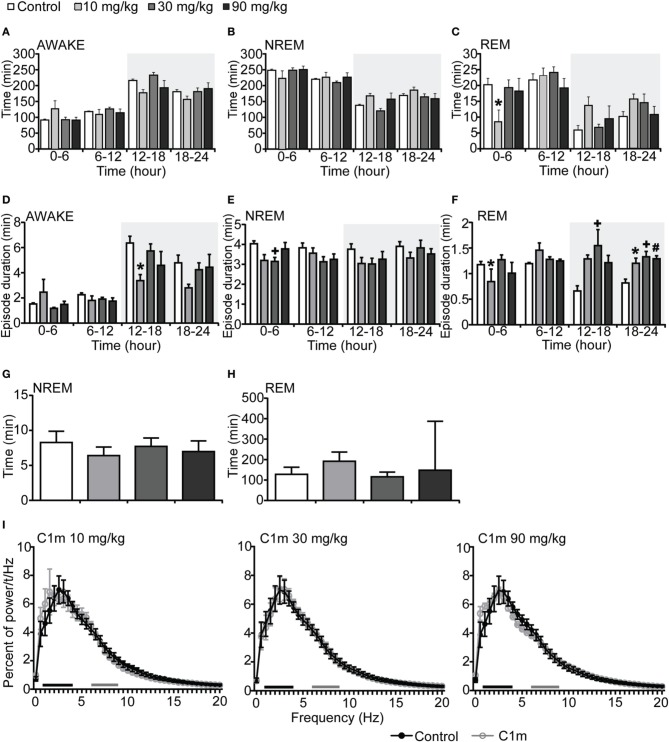
Figure 2.
Effects of C1m on basal sleep/wakefulness states in C57BL/6 mice (n = 6–7/group) after administration at start of light period. C1m (10, 30, 90 mg/kg) and methylcellulose as control were administered per os at the start of the light period (t = 0, ZT = 0). (A–C) Total time spent in wakefulness (A), NREM sleep (B), and REM sleep (C) in 6 h time windows over 24 h. (D–F) Mean duration of wakefulness (D), NREM sleep (E) and REM sleep (F) in 6 h time windows over 24 h. Data for the dark and light periods are displayed with light gray and white backgrounds, respectively. (G,H) Latency to NREM sleep (time to appearance of first NREM sleep after administration) (G) and REM sleep latency (time to appearance of first REM sleep after administration) (H) during light period. Results are expressed in minutes and presented as mean ± s.e.m. (I) EEG power density during NREM sleep for 3 h after administration shown as mean percentage of total EEG power. The delta range (0.75–4 Hz) is indicated by the black bars and the theta range (6–9 Hz) by the gray bars.*p < 0.05 for 10 mg/kg C1m, +p < 0.05 for 30 mg/kg C1m, #p < 0.05 for 90 mg/kg C1m vs. control.

