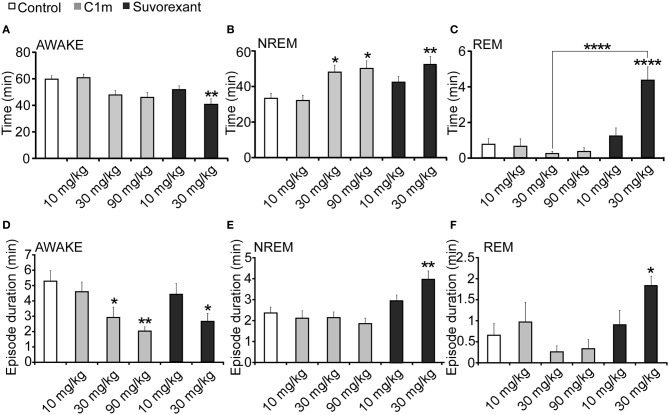
Figure 5.
Total time (A–C) and average episode duration (D–F) of awake (A,D), NREM sleep (B,E) and REM sleep (C,F) states for the first 2 h after administration of suvorexant or C1m at ZT12, compared with vehicle-administered group. Data are expressed as percentage and presented as mean ± s.e.m. (n = 6–9/group). *p < 0.05; **p < 0.01 and ****p < 0.0001.

