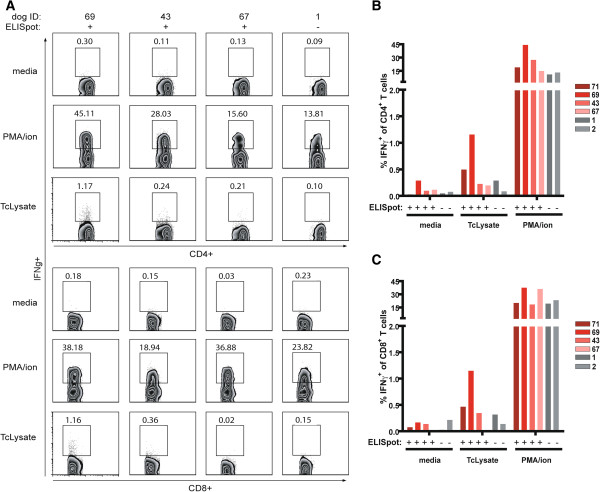
Figure 3.
Intracellular IFNγ staining identifies T. cruzi-specific CD4+ and CD8+ T cells. A, Representative flow plots of intracellular cytokine staining of T cells from ELISpot positive (71, 69, 43, 67) and negative canine (1,2) PBMC cultures incubated with media, PMA/ionomycin, or T. cruzi lysate (TcLysate). Numbers indicate percentage of IFNγ-producing CD4+ or CD8+ T cells. B-C, Percentage of IFNγ-producing CD4+(B) and CD8+(C) T cells from individual dogs. Each bar represents a dog from Argentina (red) or United States (gray). Results of reactivity in IFNγ ELISpot assay are denoted below each bar.

