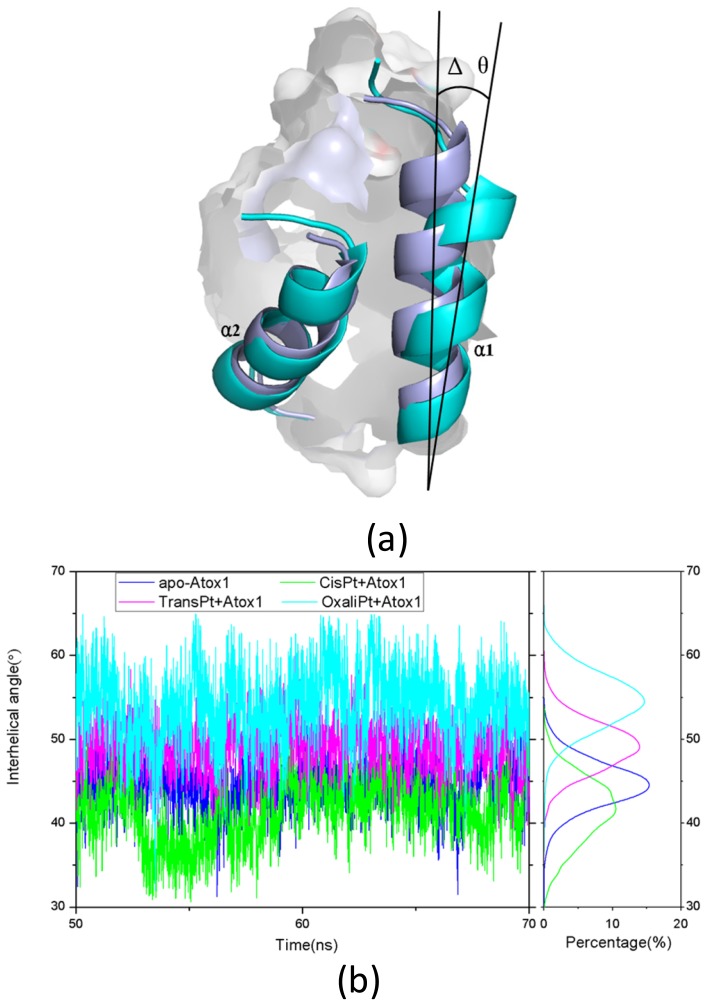
Figure 9.
(a) The change of the interhelical angle (Δθ) between the α1 and α2 helices for the apo-Atox1 model (light blue) and the binary models (cyan); and (b) The time-dependence of the interhelical angles along with the respective integrated distributions for the apo-Atox1 (light blue), CisPt + Atox1 (green), TransPt + Atox1 (magenta) and OxaliPt + Atox1 (cyan) models.

