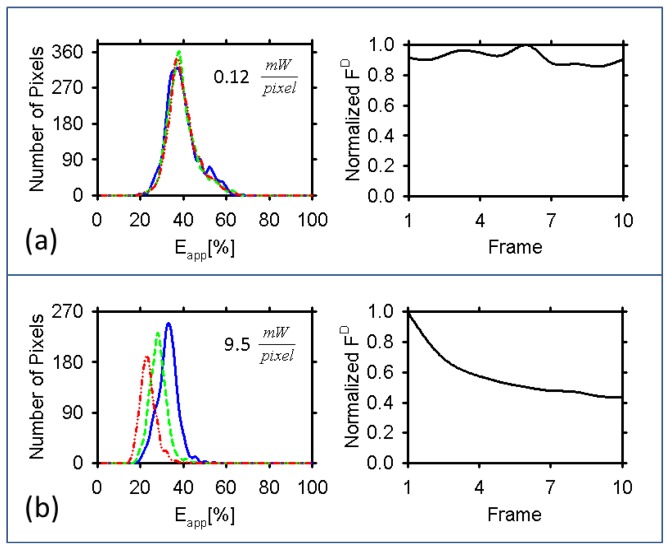
Figure 4.
Eapp histograms of a cell calculated from the FRET efficiency map as measured using the line-scan system (a) and the point scan system (b) after repeated scans of the sample along with the normalized emission of the donors corrected for FRET. Pixels for which either kDA or kAD values were within less than 2 standard deviations of the noise level were discarded from the analysis. Blue solid line: scan 1; green dashed line: scan 4; red dashed-dotted line, scan 7. The maximum values for the FD were 38,400 and 14,775 for (a) and (b) respectively, for these cells.

