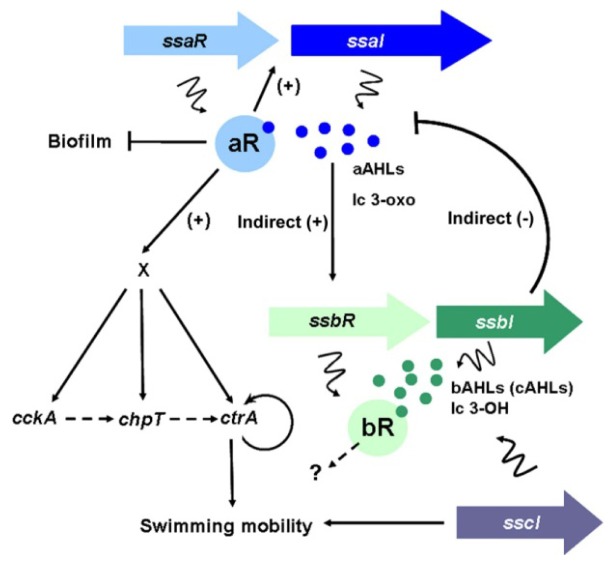
Figure 2.
Interconnected QS network and model for ssaRI and cckA-chpT-ctrA regulatory circuit that controls KLH11 flagellar motility. Lengths of the ssaRI, ssbR, and sscI genes are drawn in scale. Genes and products are colored in corresponding colors, with R-genes more darkly colored and I-genes lighter colored. The dark blue dots represent the AHLs, mainly long chain (lc) 3-oxo-HSLs, synthesized by SsaI. The dark green dots represent the AHLs, mainly long chain (lc) 3-OH-HSLs, synthesized by SsbI. Lines with bars indicate inhibition and arrows indicate activation. Squiggly lines indicate translation of genes or products of enzyme action. The dashed line with arrows indicates the potential phosphate flow from CckA to CtrA via ChpT. The curved lines with arrows around CtrA indicate positive feedback loops. The “X” indicates the unknown regulator(s). The figure is modified from references [17] and [29].

