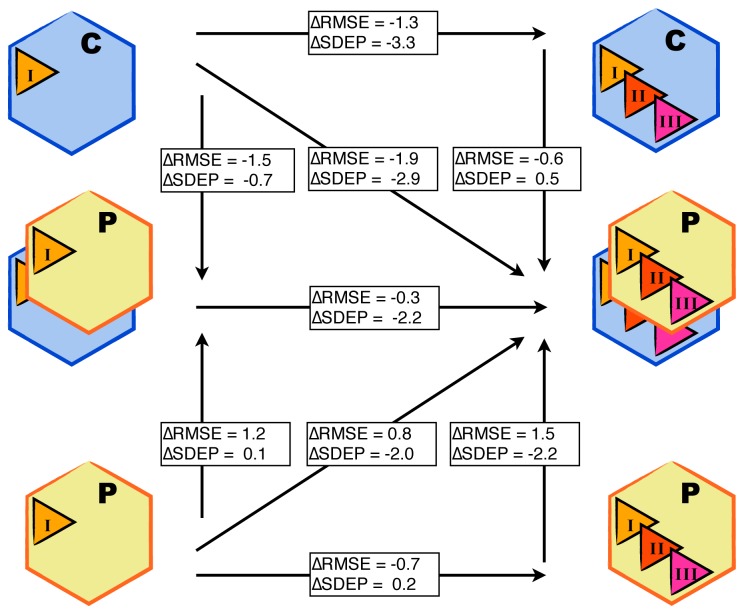
Figure 4.
Differences (Δ, in kJ mol−1) in root-mean-square errors (RMSEs) and standard deviation of prediction errors (SDEPs) between the LIE models presented in Figure 3. The models on the left include results of MD simulations starting from a single active site binding orientation of the aryloxypropanolamine compounds (from the most populated clusters I), models on the right include results of MD simulations started from three different starting poses (originating from clusters I, II and III). The top-row models are based on results of simulations starting from protein conformation CHZ170 (C). Models in the bottom row include simulations starting from the PPD70 protein template (P). Models in the middle row include results of P and C simulations.

