Figure 1.
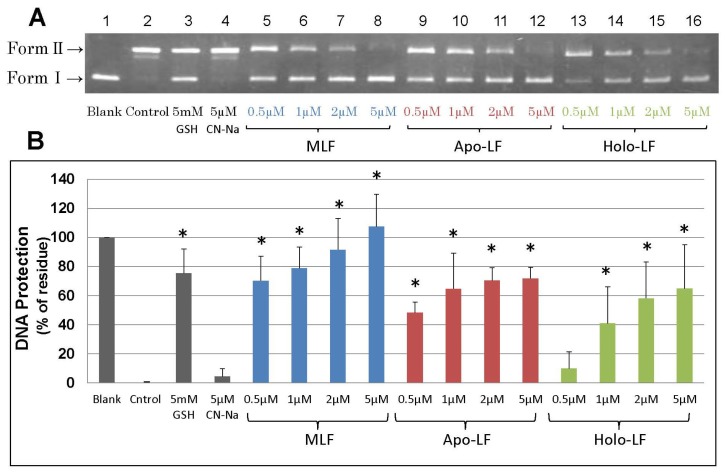
Dose response and efficacy of LFs on DNA damage by •OH generated by the Fenton reaction. Electrophoresis of plasmid DNA using an agarose gel (1.0%) was performed after exposure to •OH generated by the Fenton reaction. Experiments were conducted for 20 min at 37 °C, using iron and H2O2 (using final concentrations of 50 μL PBS, 50 μM H2O2, 5 μM FeCl3, 25 μM EDTA, and 10 μM ascorbic acid). (A) Lane 1, plasmid (Blank); lane 2, Fenton reaction mixture plus plasmid (Control); lane 3, Fenton reaction mixture plus plasmid and 5 mM GSH; lane 4, Fenton reaction mixture plus plasmid and 5 μM Casein sodium (CN-Na); lane 5, Fenton reaction mixture plus plasmid and 0.5 μM MLF; lane 6, Fenton reaction mixture plus plasmid and 1 μM MLF; lane 7, Fenton reaction mixture plus plasmid and 2 μM MLF; lane 8, Fenton reaction mixture plus plasmid and 5 μM MLF; lane 9, Fenton reaction mixture plus plasmid and 0.5 μM apo-LF; lane 10, Fenton reaction mixture plus plasmid and 1 μM apo-LF; lane 11, Fenton reaction mixture plus plasmid and 2 μM apo-LF; lane 12, Fenton reaction mixture plus plasmid and 5 μM apo-LF; lane 13, Fenton reaction mixture plus plasmid and 0.5 μM holo-LF; lane 14, Fenton reaction mixture plus plasmid and 1 μM holo-LF; lane 15, Fenton reaction mixture plus plasmid and 2 μM holo-LF; and lane 16, Fenton reaction mixture plus plasmid and 5 μM holo-LF; (B) DNA protection (%) was calculated based on the densitometry of EtBr-stained bands (Form I) against blank (non-treated plasmid DNA, lane 1) band intensities under the reaction conditions described in A (lanes 2–16). Data are presented as the mean ± S.D. of triplicate determinations. * p < 0.05 compared to the control value was considered as a statistically significant difference.

