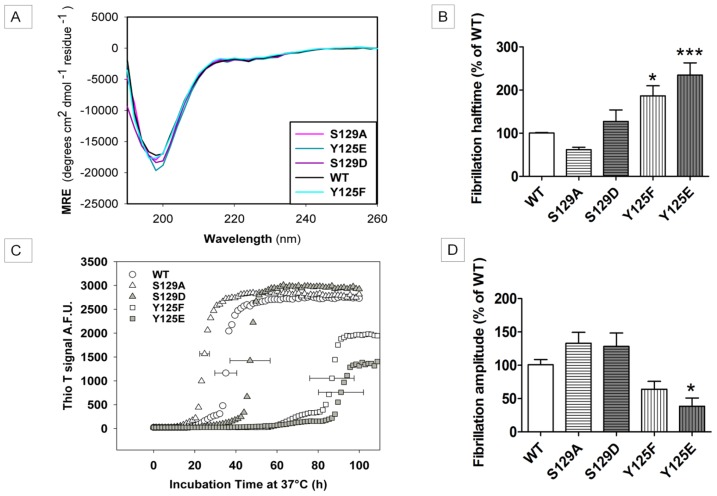
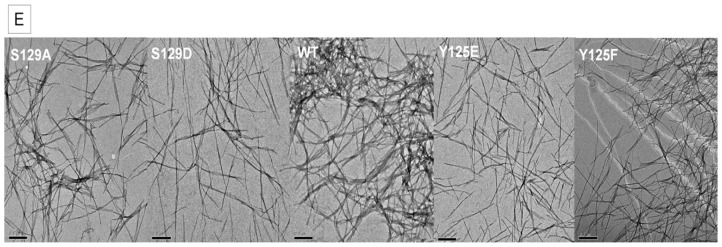
Figure 1.
Far UV-CD spectra of WT α-SYN and its phosphorylation mutants and fibrillization of WT α-SYN compared to the phosphorylation mutants. (A) Far UV-CD spectra of α-SYN and phosphorylation mutants were taken at the start point of further measurements to account for possible secondary structure differences due to the mutations. All spectra have a minimum near 200 nm, typical for a random coil structure. The phosphorylation mutants (Y125F (cyan), Y125E (dark cyan), S129A (pink), S129D (purple)) show spectra similar to that of the WT protein (black), and our obtained values of approximately −20,000 MRE (mean residue ellipticity) correspond well to values of monomeric WT α-SYN found in literature. The kinetics of the fibrillization process of α-SYN WT and phospho-mutants were followed by a Thioflavin T assay under continuous shaking (270 rpm) at 37 °C. A concentration of 50 μM α-SYN was used in each experiment; (B) Mean values of the halftimes; The halftimes of fibrillization are expressed as percentages of WT, which was set to 100%; (C) Representative figure showing an inhibitory effect with both tyrosine mutants (Y125F (white squares) and Y125E (gray squares)). The kinetics of both serine mutants, however, are similar to that of the WT protein (S129A (white triangles), S129D (gray triangles) and WT (white circles)); (D) Mean end phase fluorescence intensities; (B) and (D) are calculated from 5 independent measurements (n = 5) each done in quadruplicate, with the standard error of mean (SEM) shown on each bar. * and *** indicate a statistical significant difference when compared to WT with a p-value < 0.05 and < 0.001 respectively; TEM images were taken and are represented in (E), from left to right: S129A, S129D, WT, Y125E, Y125F. The scale bars are set to 200 nm.


