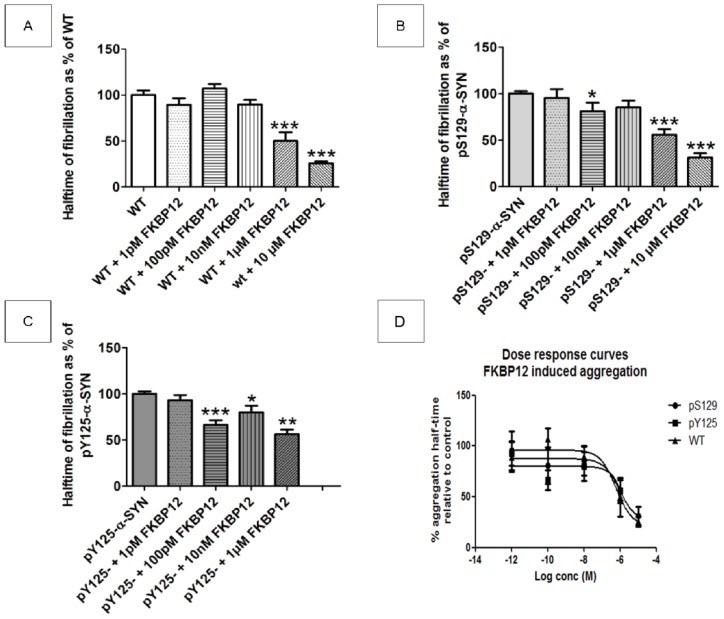
Figure 4.
The influence of FKBP12 on the fibrillization of (phosphorylated)-α-SYN. The influence of FKBP12 on the fibrillization kinetics of WT α-SYN (A); pS129-α-SYN (B) and pY125-α-SYN (C) (all 30 μM). For FKBP12 a concentration range was used: no FKBP12, 1 pM FKBP12, 100 pM FKBP12, 10 nM FKBP12, 1 μM FKBP12 and 10 μM FKBP12. Mean halftimes are shown and were obtained from four independent measurements (n = 4) each done in quadruplicate, SEM is shown on the bars. The conditions with FKBP12 present are expressed as percentages of the respective control: α-SYN (WT, pS129 or pY125) without FKBP12, *, ** and *** indicate a statistical significant difference when compared to WT with a p-value < 0.05, a p-value < 0.01 or a p-value < 0.001 respectively; and (D) Values of aggregation half-times from Figure 4 are plotted in an x–y plot and a dose response curve is fitted using GraphPad Prism (least squares method, fit equation is Y = Bottom + (Top − Bottom)/(1 + 10(X – log EC50)). The EC50 values of FKBP12 in reducing the aggregation half-time of the different α-SYN variants are comparable for all experimental groups, ranging from 0.6 to 1 μM. WT, normal α-SYN; pS129, α-SYN phosphorylated at S129 by PLK2; pY125, α-SYN phosphorylated at Y125 by Fyn kinase.

