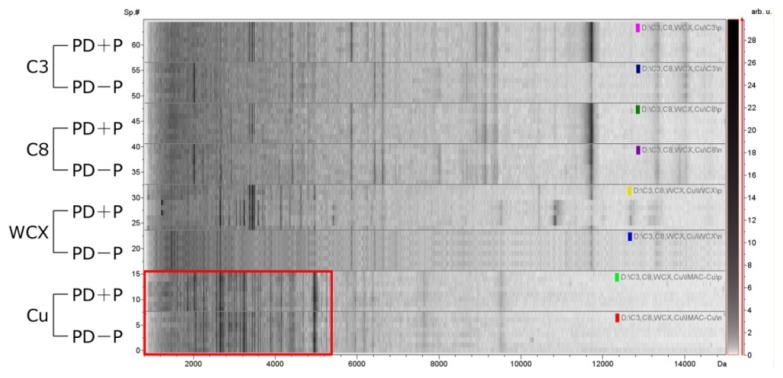
Figure 1.
Protein profiles obtained with various chemical affinity beads. Peptides and proteins were captured by magnetic bead-based technology using C3, C8, weak cation exchange (WCX), and immobilized metal-affinity chromatography (IMAC-Cu) beads. In each panel, the compiled protein spectra from the PD + P and PD − P samples for each bead type are shown with the density plots of individual peritoneal dialysis effluent (PDE) profiles. X-axis, the calculated molecular mass (m/z values); Y-axis, relative intensity of specific samples. The differential density along the x-axis represents the specific peptide that distinctly presents in the samples. IMAC-Cu shows adequate protein profiles across all beads (labeled with a red frame).

