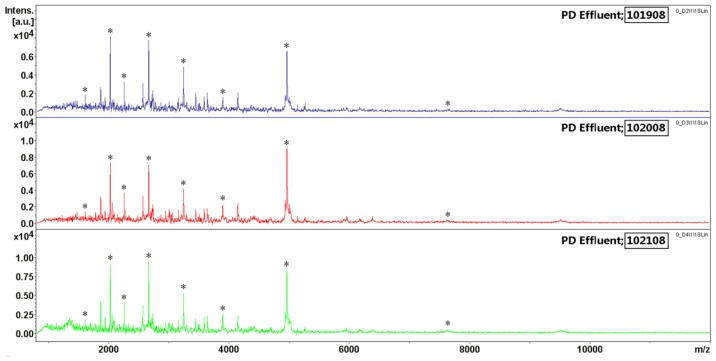
Figure 4.
The inter-day reproducibility study for MALDI-TOF MS measurement. The sample was split into three vials and processed on different days (marked 101908; 102008; 102108). The variability in signal intensity was estimated across eight MS signals of high, medium, and low abundances within the mass range of m/z 1–15 kDa. The ratios of the signal intensities are listed in Table 4. * selected MS signals.

