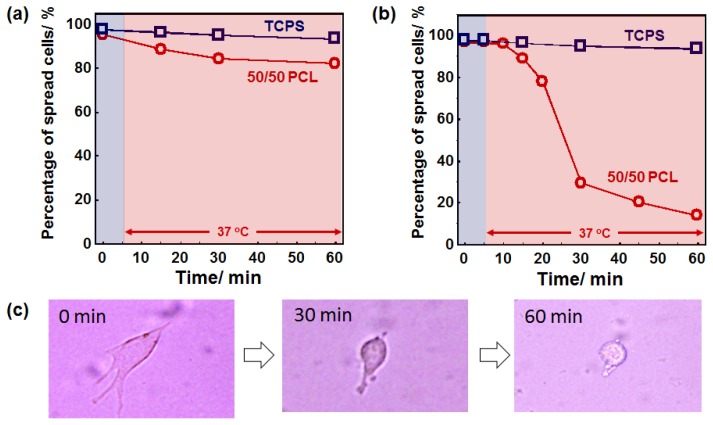
Figure 6.
Time-dependent changes in the cell morphologies on PCL films after the crystal-amorphous transition. Cells were cultured on the films at 32 °C for 24 h. The cells were then subjected to a 37 °C heat treatment. The percentage of spread cell numbers on the surface was plotted against time. (a) Fibroblast; (b) Myoblast; (c) Phase contrast images of myoblasts on 50/50 PCL film after heat treatment.

