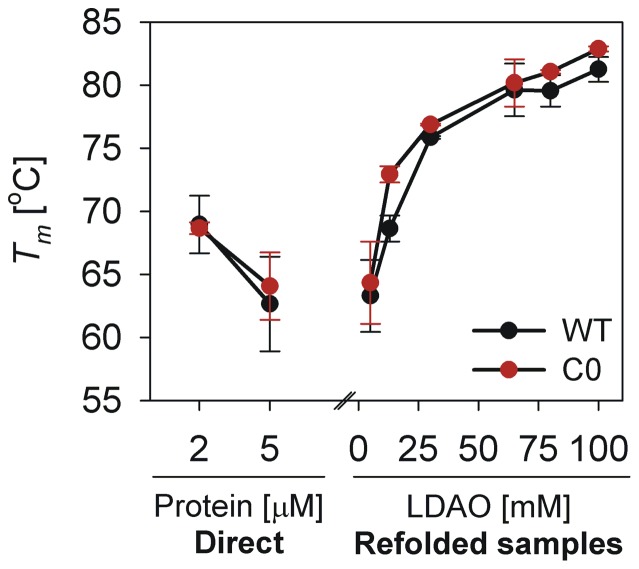
Figure 3. Correlation between Tm of refolded hVDAC-2 and LDAO concentration.
Tm values obtained in the various LDAO concentrations described in this study show a near-exponential increase with LDAO concentration, till ∼65 mM. Increasing in LDAO concentration beyond ∼65 mM does not substantially change the Tm. The Tm of samples that were directly refolded in 5 mM LDAO (labeled ‘Direct’), has been included for comparison, to emphasize the importance of LPR as well as absolute LDAO concentrations during hVDAC-2 refolding. The latter samples exhibit a Tm comparable to those prepared by dilution of the refolding stock to obtain the same LPRs; however, unfolding cooperativity is lost in the ‘Direct’ samples (see inset of Figure 2), emphasizing the importance of absolute LDAO concentration during refolding for protein stability. Tm values were obtained from fits of three independent T-scan unfolding experiments to a two-state equation.

