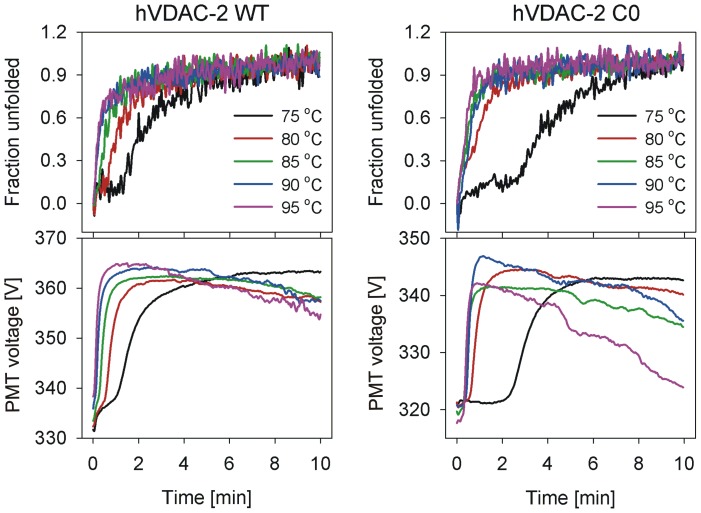
Figure 4. Isothermal unfolding kinetics monitored using ME215 for hVDAC-2.
The upper panels show the representative data obtained in 30215 for both WT (left) and C0 (right). The lower panels show the corresponding change in the photomultiplier tube (PMT) voltage, which measures light scattering from the sample (color codes are the same for all the panels). Note the rise in PMT voltage as the protein loses secondary structure and aggregates, and the drop when the aggregates start to settle. The unfolding process starts a little later for C0 (for instance, compare the 75°C fraction unfolded data shown in black) although aggregation rate is faster for C0 (compare the 95°C PMT voltage data shown in purple).

