Figure 3.

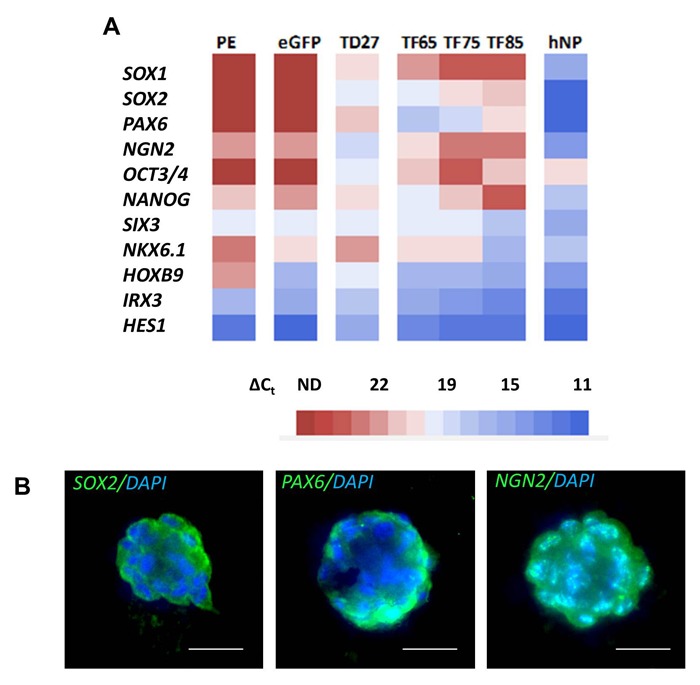
Figure 3: Characterization of induced neural precursor cells. (A) Gene expression profiles of independent iNP colony lines generated by protein transduction (TD) or plasmid transfection (TF) at different time points post transcription factor delivery compared to eGFP transfection (eGFP), PE transduction (PE) and hESC-derived neural precursor cell (hNP) controls. Heatmap represents the average cycle threshold values normalized to internal ribosomal 18S rRNA control (∆Ct) obtained from three independent qPCR reactions, respectively. (B) Expression of SOX2, PAX6 and NGN2 in iNP colonies. Scale bars: 25 µm.
