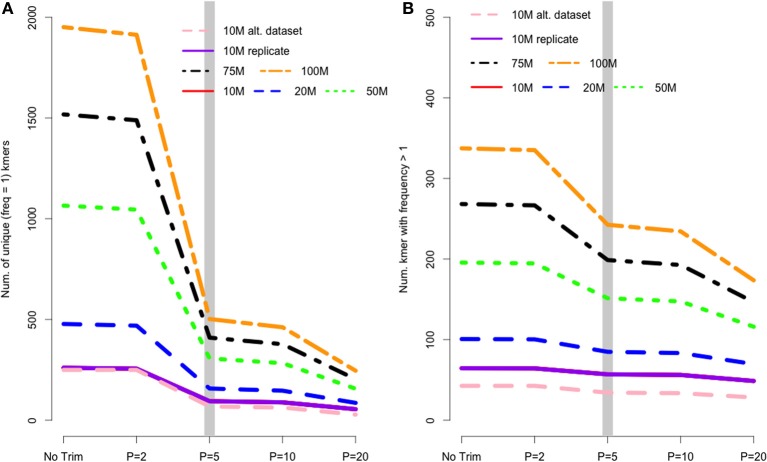
Figure 2.
(A) The number of unique kmers removed with various trimming levels across all datasets. Trimming at Phred = 5 results in a substantial loss of likely erroneous kmers, while the effect of more and less aggressive trimming is more diminished. (B) Depicts the relationship between trimming and non-unique kmers, whose pattern is similar to that of unique kmers.

