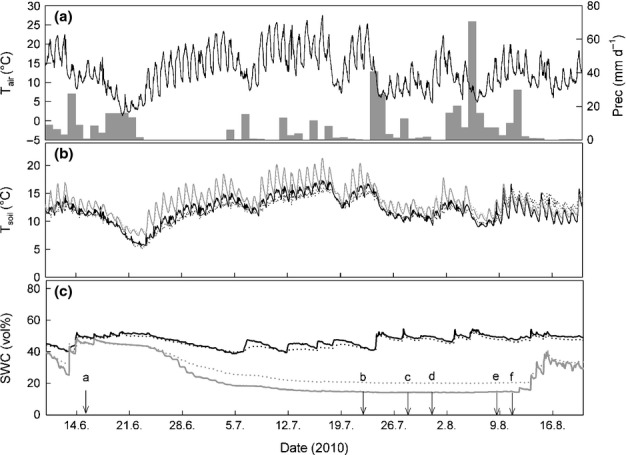
Figure 1.

Microclimate during the drought experiment: (a) air temperature (Tair; in °C 0.5 h−1) and precipitation (prec; in mm d−1); (b) soil temperature (Tsoil; in °C 0.5 h−1) and (c) volumetric soil water content (SWC; in %) at 5 (solid lines) and 10 cm soil depth (dotted lines) in control (black) and drought (grey) plots. Arrows with lowercase letters in (c) indicate dates of action: ‘a’ marks the beginning of the drought treatment; ‘b’, ‘c’ and ‘d’ indicate dates of pulse-labelling; ‘e’ indicates mowing and ‘f’ indicates rewetting and thus the end of the drought treatment.
