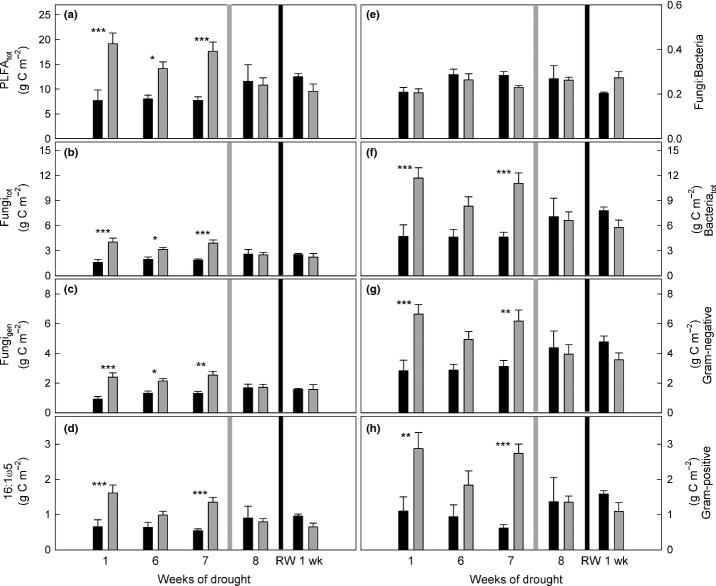
Figure 2.
Microbial biomass over the course of the experiment (in g PLFA-C m−2 calculated for the uppermost 10 cm of soil; n = 3; error bars show +SE) in control (black bars) and drought (grey bars) plots. (a) Total phospholipid fatty acids (PLFAtot) were divided into (b) total fungal (Fungitot) and (f) total bacterial (Bacteriatot) PLFAs. Fungal PLFAs were further separated into (c) general fungal PLFAs (Fungigen) and (d) 16:1ω5. Bacterial PLFAs were subdivided into (g) Gram-negative and (h) Gram-positive markers. (e) The ratio of Fungitot to Bacteriatot. Light grey lines indicate mowing of aboveground biomass, and black lines rewetting. Asterisks indicate significant differences between treatments at single samplings (one-way ANOVA; *, P < 0.05; **, P < 0.01; ***, P < 0.001).

