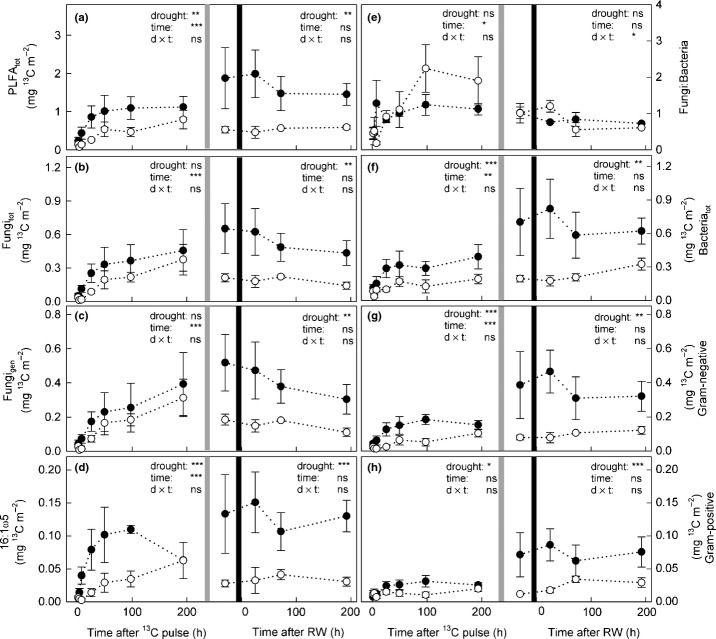
Figure 5.
13C excess (in mg 13C m−2) after pulse-labelling in (a) total phospholipid fatty acids (PLFAtot), and (b) total fungal (Fungitot) and (f) total bacterial (Bacteriatot) PLFAs, and (e) the ratio of fungal to bacterial 13C uptake in control (closed circles) and drought (open circles) plots over time. Fungal PLFAs were grouped into (c) general fungal marker and (d) 16:1ω5 PLFAs, and bacterial PLFAs into (g) Gram-negative and (h) Gram-positive PLFAs. Values were calculated for the uppermost 10 cm of soil. Mowing is indicated by light grey lines and rewetting is indicated by black lines. Effects of drought before and after cutting were analysed separately by two-way repeated-measures-ANOVA (ns, not significant; *, P < 0.05; **, P < 0.01; ***, P < 0.001; further details are given in Table 2).

