
Figure 1.
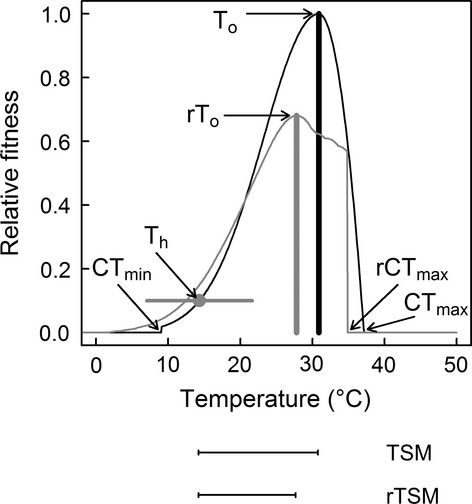
Effect of daily temperature variation on ectotherm fitness. Fundamental performance curve (relative fitness; black line) under constant temperature conditions and realized performance when appropriate daily temperature variation is considered (grey line) for the temperate terrestrial insect Muscidifurax zaraptor. Gray data point and horizontal grey line represent the mean habitat temperature (Th) and the average habitat temperature range, respectively. CTmin, critical minimum temperature; (r)To, (realized) optimum temperature; (r)CTmax, (realized) critical maximum temperature; and (r)TSM, (realized) thermal safety margin.