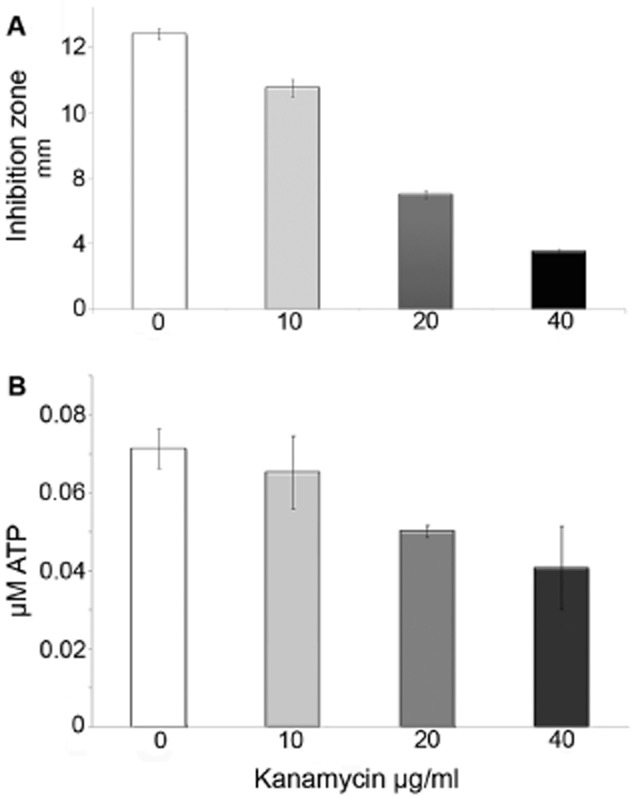
Figure 6.

Resistance to kanamycin is negatively correlated with ATP levels. Explorers were isolated from 10, 20, 40 μg ml−1 kanamycin (x-axis).A. The resistance of explorers to kanamycin was examined using disk diffusion assay containing 50 μg kanamycin. The bars represent the averaged radius of inhibition zone, which indicates the resistance level of explorers (P < 1 × 10⁻⁴) (i.e. smaller radius indicates higher resistance). The resistance increases with the increase in kanamycin concentrations during the pre-exposure.B. The bars show the level of cellular ATP of explorers isolated from similar concentrations of kanamycin (P < 0.05). The assay was performed using ATPlite kit. There is a negative correlation between ATP cellular levels and kanamycin concentrations. Combining linear dependences of A and B, one can see that the cellular levels of explorers’ ATP are negatively correlated with resistance to kanamycin.
