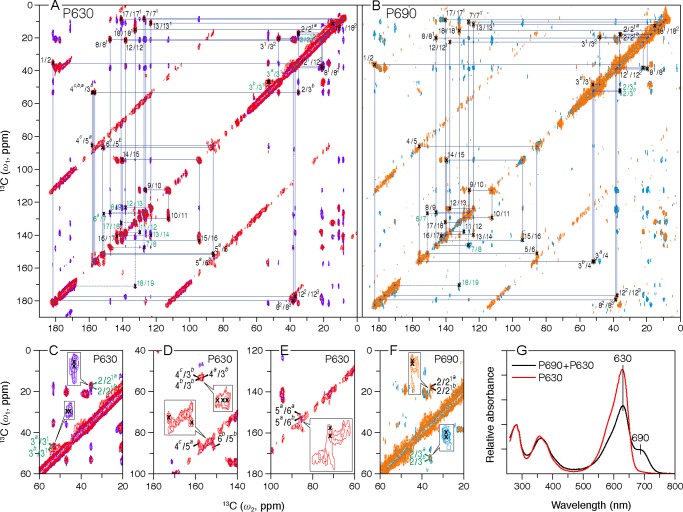
FIGURE 1.
Two-dimensional MAS NMR 13C–13C homonuclear dipolar correlation spectra of [U-13C,15N]PCB-SyB.Cph2(GAF). Polarization transfer times of 5 and 50 ms were employed for the P630 (A, red and purple, respectively) and P690 (B, orange and cyan, respectively) states. The blue lines in two full contour plots indicate sequences of nearest-neighbor correlations (for numbering see Fig. 3, inset; for full assignments, including indirect-bonded correlations for P630 and P690 and one-dimensional spectra, see supplemental Figs. S2 and S3, respectively). The observed 13C signal splittings of a subset of carbon resonances are illustrated in C–F for P630 and P690, respectively (expansions are inset). The data were collected with an 8-ms evolution in the indirect dimension; 1434 complex t2 and 128 real t1 points with 2048 scans. A relaxation delay of 1.5 s was applied. G, UV-visible absorbance spectra of the SyB.Cph2(GAF) preparations used in this study. The spectra of P630 and of the P690/P630 photoequilibrium mixture were measured following irradiation with >700 and 525 nm light, respectively, as described.

