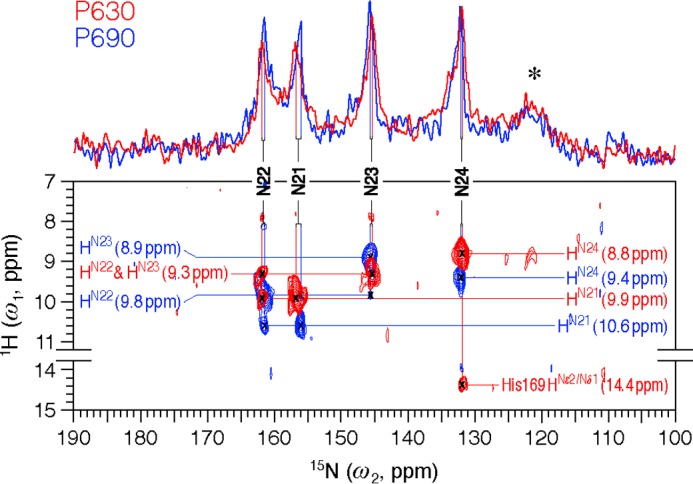
FIGURE 2.

Two-dimensional MAS NMR 1H–15N frequency-switched Lee-Goldburg decoupled dipolar correlation spectra of [u-13C,15N]-PCB-SyB.Cph2(GAF) as P630 (red) and P690 (blue). The regions without resonances are omitted. Two one-dimensional traces onto the 15N dimension are shown. 15N resonances (N21–N24) are indicated by vertical lines. All four NH protons (HN21-N24) are fully resolved and marked by horizontal lines. The asterisk indicates protein backbone signals in natural abundance. The spectra were acquired with 1536 complex t2 and 128 real t1 points and 2152 scans. An LG-CP contact time of 2.048 ms was applied. The relaxation delay was 1.8 s.
