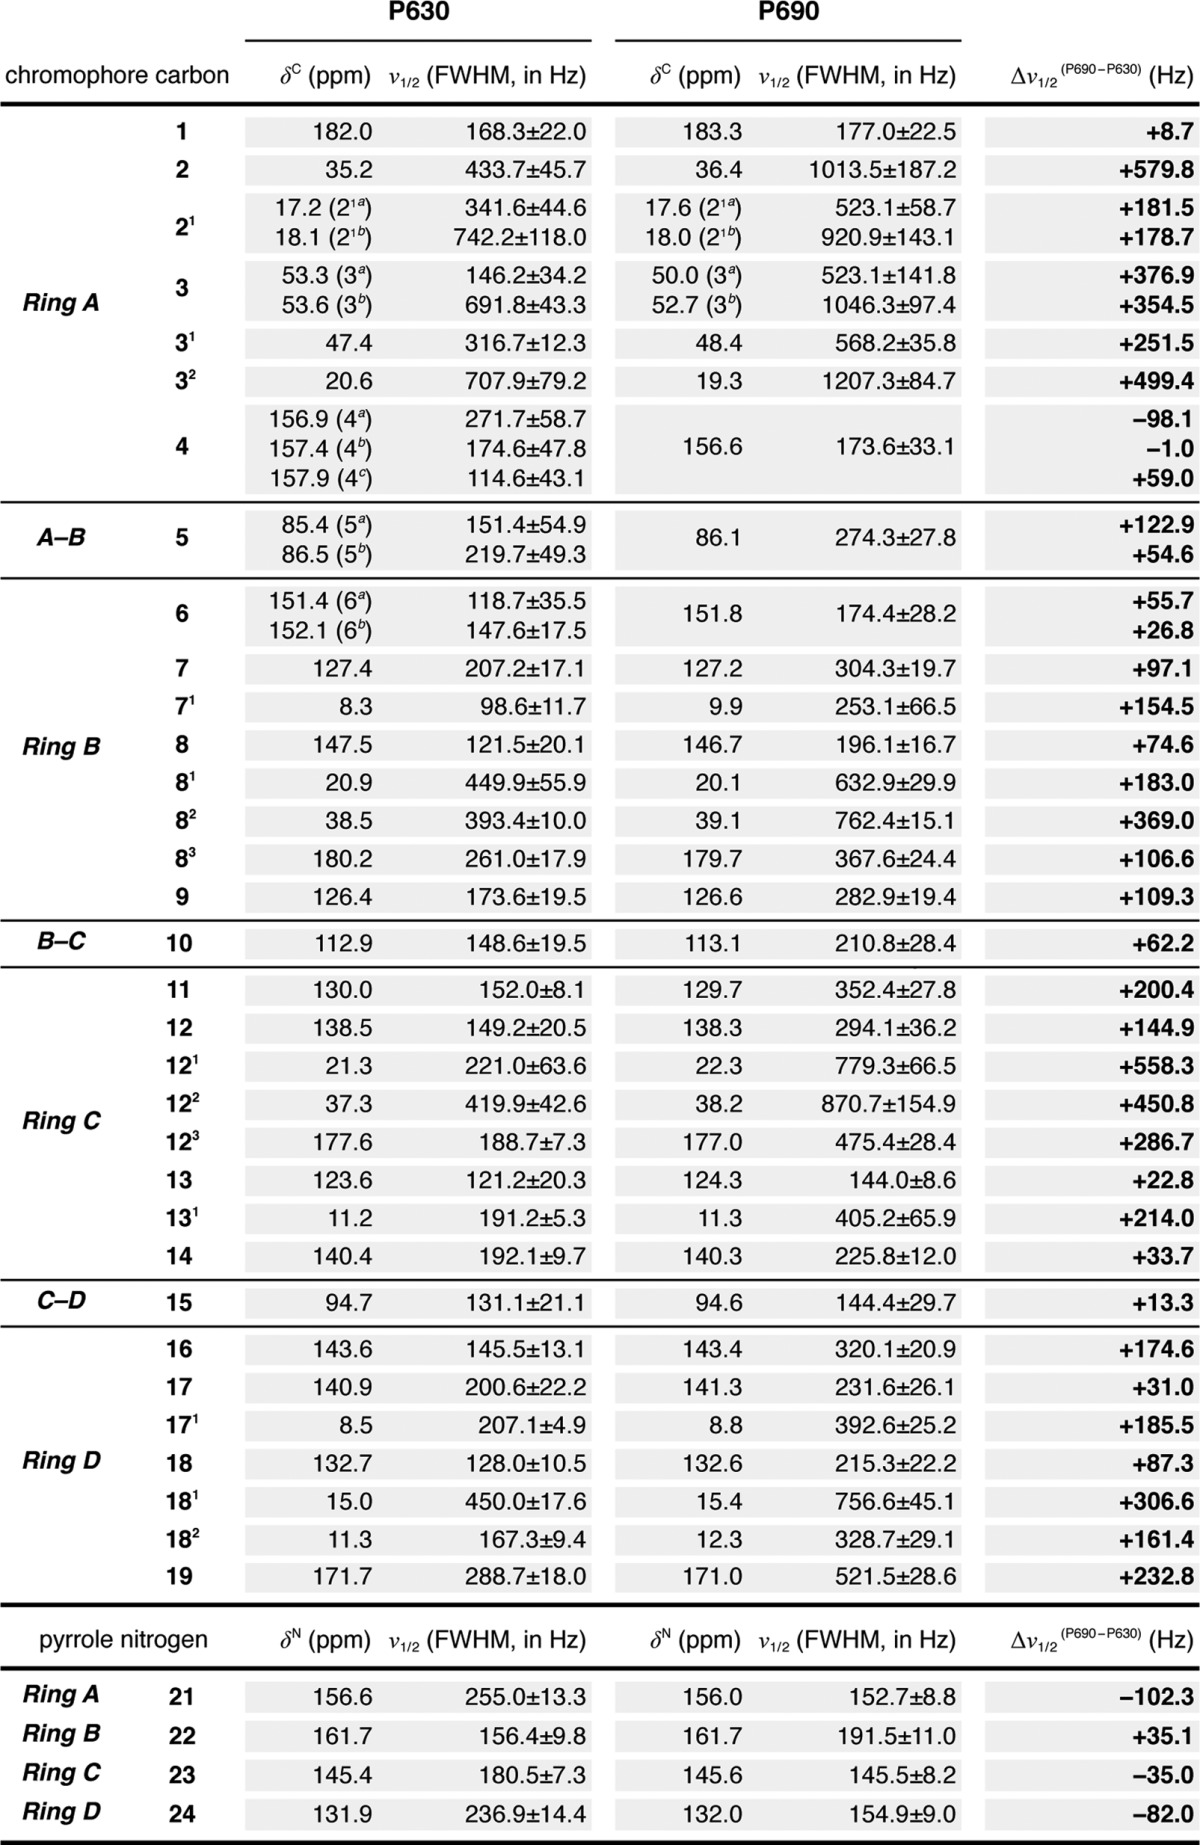
TABLE 2.
Full-width at half-maximum (FWHM) line widths (ν½) of 13C and 15N resonances of the chromophore in SyB.Cph2(GAF)
13C and 15N experimental line shapes were simulated by the Voigt function (convolution of a Lorentzian with a Gaussian at an equal ratio). The v½ values listed (mean ± S.D.) were extracted from the Voigt profile (fitting spectra not shown). Δν½ values are reported as P690-P630 and are listed in the right-most column.

