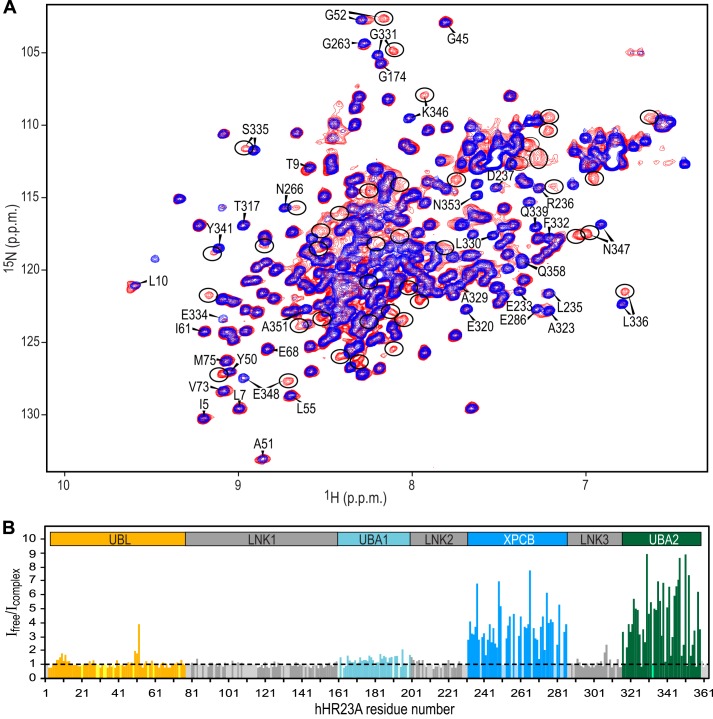
FIGURE 2.
Analysis of resonance intensities permits the identification of Vpr-binding regions in hHR23A. A, superposition of the 800-MHz 1H-15N HSQC spectra of hHR23A alone (blue) and the hHR23A-Vpr complex (red) at 298 K. Selected hHR23A resonances are labeled with residue names and numbers. Vpr-bound hHR23A resonances are encircled. B, ratio of 1H-15N HSQC resonance intensities (Ifree/Icomplex) for free hHR23A resonances in the sample of free hHR23A (Ifree) and the hHR23A-Vpr complex (Icomplex) sample. The data are color-coded according to domains in hHR23A: UBL (orange); LNK1, LNK2, and LNK3 (gray); UBA1 (light blue); XPCB (blue); and UBA2 (green). Ifree/Icomplex values for prolines and unassigned residues were arbitrarily set to 1 and colored according to domains using the same color scheme but in a lighter shade.

