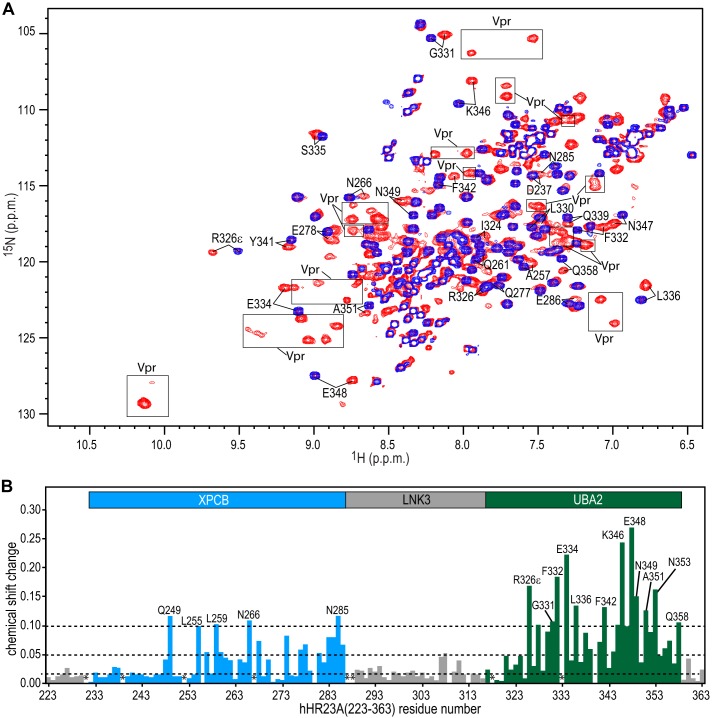
FIGURE 3.
NMR chemical shift changes of hHR23A(223–363) amide resonances induced by Vpr binding. A, superposition of the 900-MHz 1H-15N HSQC spectra of hHR23A(223–363) alone (blue) and the hHR23A(223–363)-Vpr complex (red) at 291 K. Representative hHR23A(223–363) resonances are labeled with residue names and numbers. Note that the hHR23A(223–363)-Vpr complex spectrum (red) also contains Vpr resonances (enclosed by rectangles) because the proteins were coexpressed and, therefore, both labeled with 15N and 13C. B, 1H,15N-combined chemical shift differences, plotted along the linear amino acid sequence, calculated using the equation (ΔδHN2 + (0.14*ΔδN)2)1/2, with ΔδHN and ΔδN representing the 1HN and 15N chemical shift differences between resonances of the free and the Vpr-bound hHR23A(223–363).

