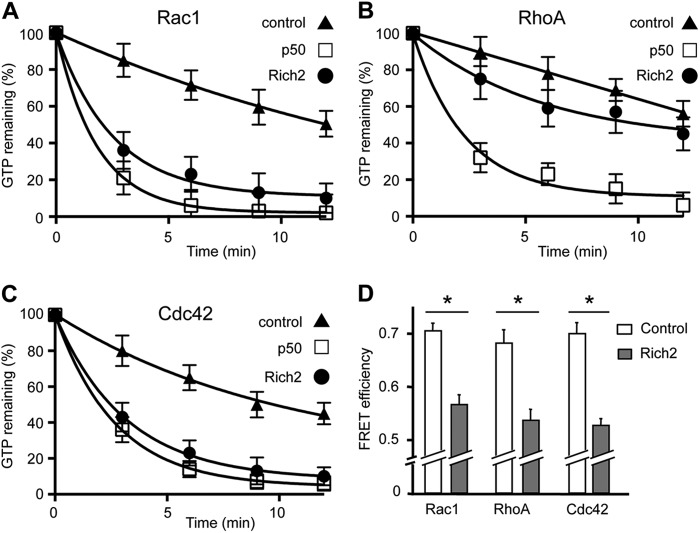
FIGURE 2.
Measurements of Rich2 Rho-GAP activity in vitro. A–C, Rich2 Rho-GAP activity measured by GTPase assay. Time course of GTP hydrolysis measured on [γ-32P]GTP-loaded RhoA, Rac1, and Cdc42 GTPase, in the absence (control) and presence of the widely expressed p50 Rho-GAP (p50; Ref. 28) or Rich2. The p50 and Rich2 curves in A, p50 in B, and p50 and Rich2 in C are significantly different from their respective control curves (p < 0.001, two-way ANOVA). D, Rho-GAP function of Rich2 measured by FRET in COS-7 cells, using pRAICHU probes for Rac1, RhoA, and Cdc42. Please note that Rich2 displays a GAP activity for all members of the Rho-GTPase family. (*, p ≤ 0.01, n = 3).

