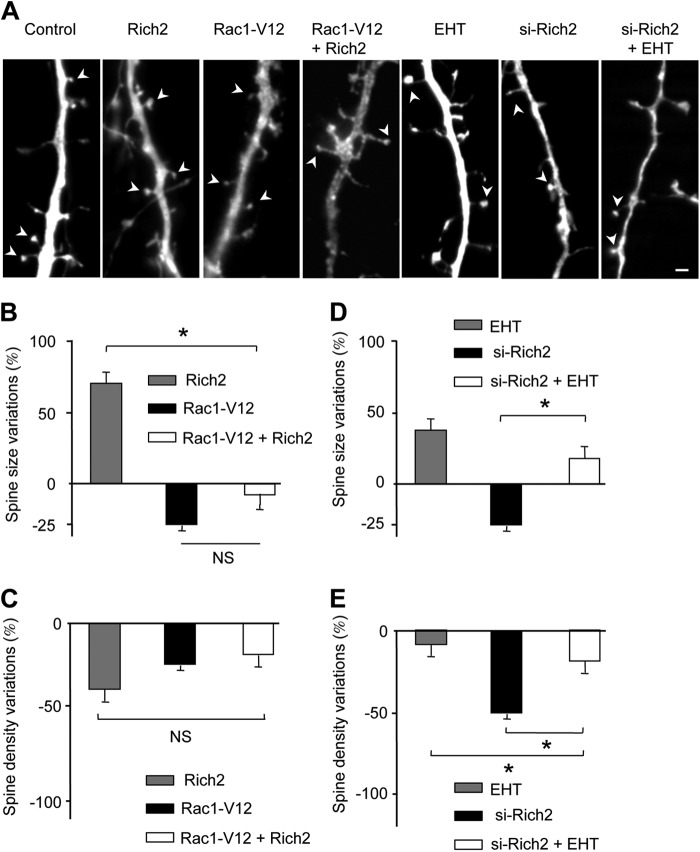
FIGURE 6.
The effects of Rich2 on spine morphology involved Rac1 activity. A, portions of dendrites showing spines (arrowheads) of DIV-11 hippocampal neurons transfected with YFP alone (control), or in combination with the indicated plasmids and tested at DIV-12, or treated for 24 h with 10 μm EHT-1864 (EHT). B–E, histograms represent changes in size of spine head and spine density relative to control values (spine head size: 0.30 ± 0.02 μm2 and spine density: 5.9 ± 1.0/10 μm) in neurons transfected as indicated in A (n = 14 neurons in each condition, *, p < 0.001, NS, not significantly different; scale bar: 2 μm).

