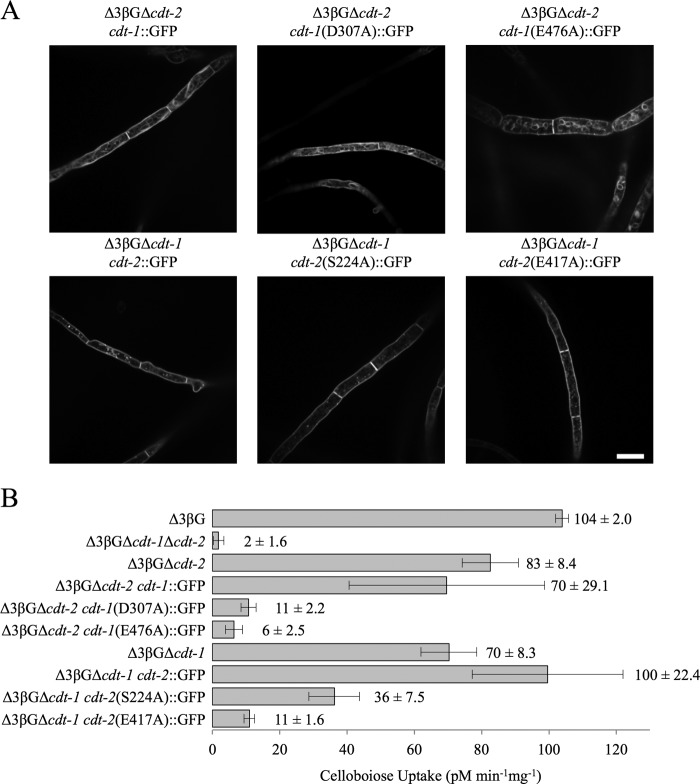
FIGURE 5.
Uptake of cellobiose by N. crassa strains expressing untagged and/or GFP-tagged cellodextrin transporters. A, fluorescence microscopy of WT and GFP-tagged point mutants after 24 h induction with 2% cellobiose. Scale bar: 10 μm. B, cellobiose uptake in the Δ3βG, Δ3βGΔcdt-1Δcdt-2, Δ3βGΔcdt-2, Δ3βGΔcdt-2 cdt-1::GFP, Δ3βGΔcdt-2 cdt-1(D307A)::GFP, Δ3βGΔcdt-2 cdt-1(E476A)::GFP, Δ3βGΔcdt-1, Δ3βGΔcdt-1 cdt-2::GFP, Δ3βGΔcdt-1 cdt-2(S224A)::GFP, and Δ3βGΔcdt-1 cdt-2(E417A)::GFP strains after 24 h induction with 2% cellobiose.

